
FIGURE 3.
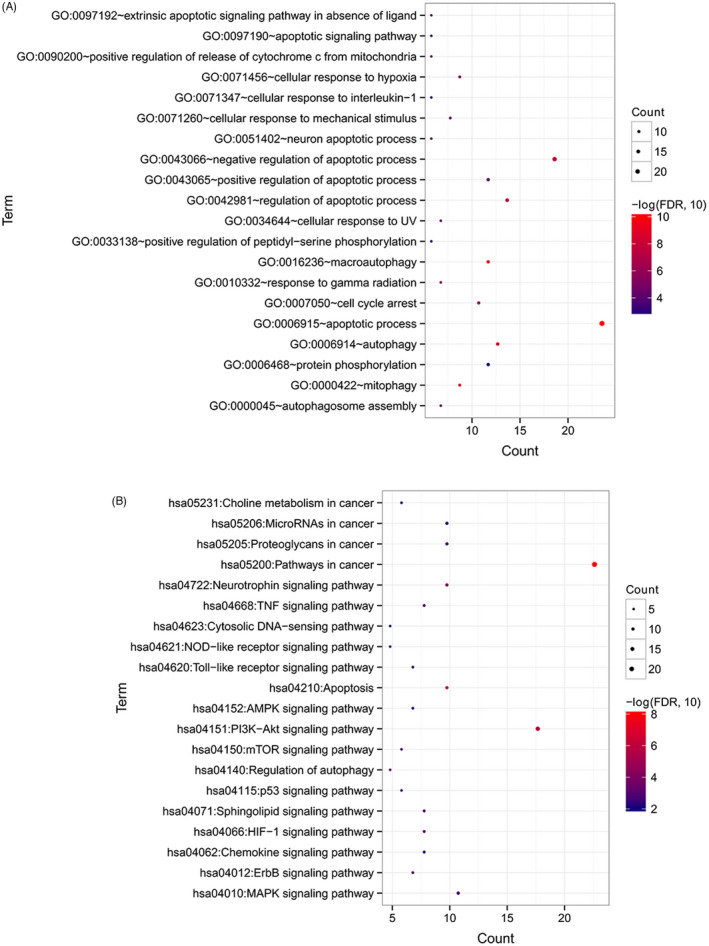
GO function and KEGG pathway enrichment analysis. (A) Significant biological processes identified by GO enrichment analysis. (B) Significant signaling pathways identified by KEGG pathway enrichment analysis. Count denotes the number of significantly enriched genes involved in a GO biological process or a signaling way. Size of round nodes is positively correlated with count of genes