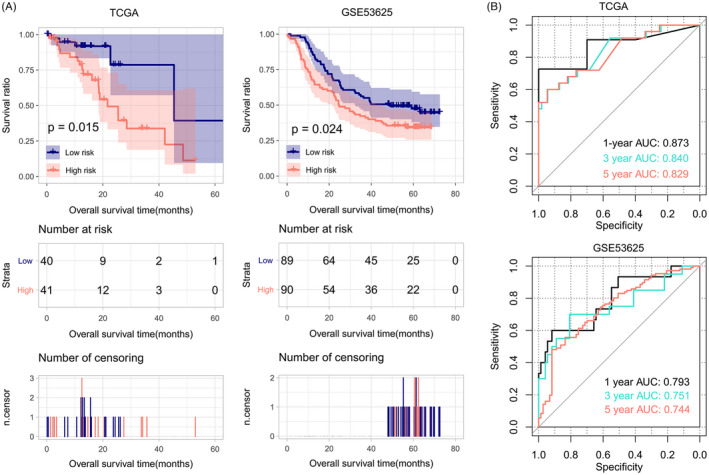
FIGURE 5.

Kaplan–Meier overall survival curves (A) and ROC curves (B) for the TCGA set and GSE53625. Patients are divided into a high‐risk group and a low‐risk group by the six‐gene PS model. The high‐risk group has significantly lower survival ratio compared to the low‐risk group (p = 0.015, 0.024)
