FIGURE 6.

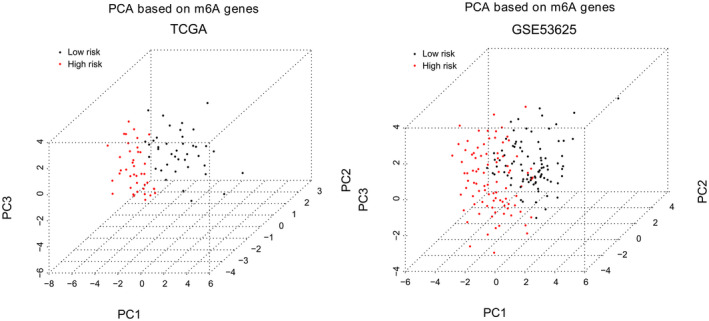
PCA maps show separation of high‐risk patients from low‐risk patients based on m6A genes in the TCGA set and GSE53625 dataset

PCA maps show separation of high‐risk patients from low‐risk patients based on m6A genes in the TCGA set and GSE53625 dataset