
FIGURE 7.
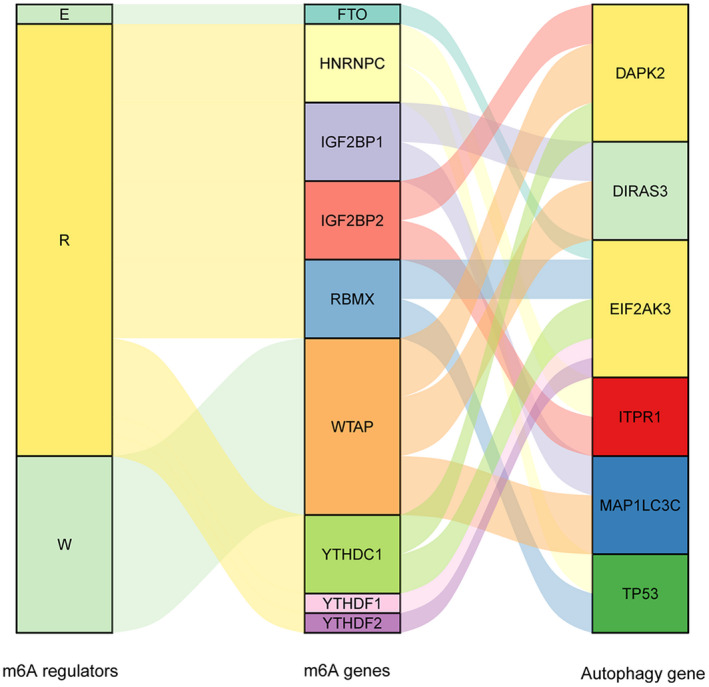
Schematic illustration of correlations between m6A genes, m6A regulators, and autophagy genes in Sankey charts
Official websites use .gov
A
.gov website belongs to an official
government organization in the United States.
Secure .gov websites use HTTPS
A lock (
) or https:// means you've safely
connected to the .gov website. Share sensitive
information only on official, secure websites.
Schematic illustration of correlations between m6A genes, m6A regulators, and autophagy genes in Sankey charts