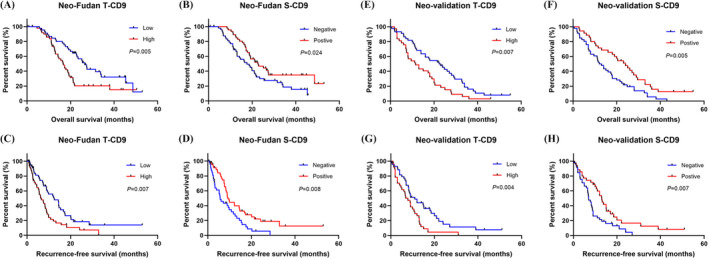
FIGURE 2.

Survival analyses for OS and RFS of patients from neoadjuvant chemotherapy group with different CD9 expression in tumor and stroma. Kaplan–Meier survival curves for OS of patients in the Fudan cohort with different CD9 expression in tumor (A) and stroma (B). Kaplan–Meier survival curves for RFS of patients in the Fudan cohort with different CD9 expression in tumor (C) and stroma (D). Kaplan–Meier survival curves for OS of patients in the validation cohort with different CD9 expression in tumor (E) and stroma (F). Kaplan–Meier survival curves for RFS of patients in the validation cohort with different CD9 expression in tumor (G) and stroma (H)
