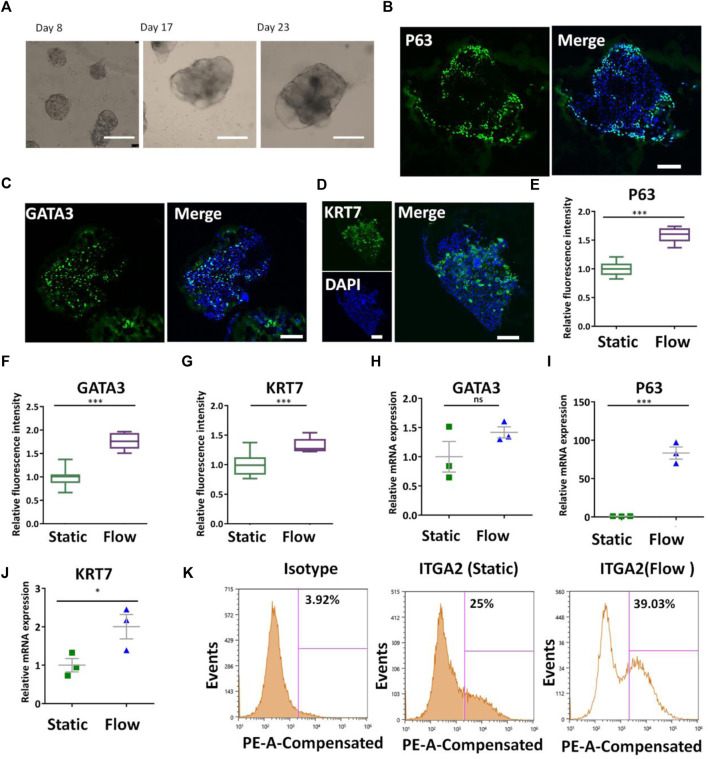
FIGURE 3.
Differentiation of CTBs in the formed tissues under dynamic conditions. (A) Bright-field images of the growth of 3D tissue on different days (8, 17, and 23) after exposure to a medium with a cocktail of defined factors at the perfusion of 1 ml/min. Scale bars, 200 μm. (B–D) Immunofluorescence image of the analysis of CTB markers P63, GATA3, and KRT7 under dynamic conditions. Scale bars, 100 μm. (E–G) P63+, GATA3+, and KRT7+ cells were quantified in 3D tissues under static and dynamic conditions. The data are indicated as mean ± SEM (n > 3). (H–J) Expression levels of P63, GATA3, and KRT7 genes in 3D tissues under different conditions were probed by qRT-PCR. Data were mean ± SEM (n = 3). GAPDH was used as the reference gene. (K) ITGA2+ cell population in 3D tissues under different culture conditions was quantified by flow cytometry analysis. The data were analyzed using Student’s t-test (*p < 0.05; **p < 0.01; and ***p < 0.001).

