FIGURE 4.
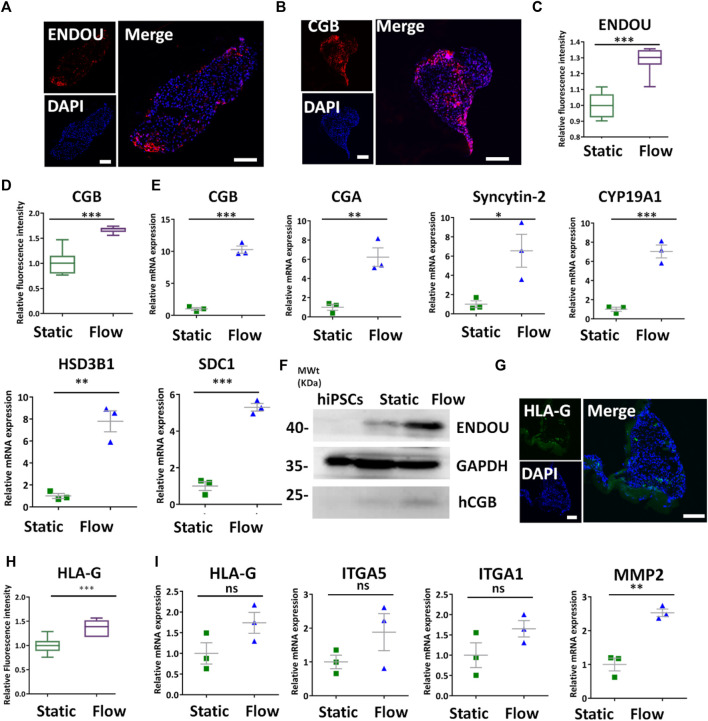
Characterization of STBs and EVTs’ differentiation in 3D tissues under dynamic conditions. (A,B) Representative immunofluorescent images showing the STB-associated markers ENDOU and CGB under dynamic conditions at the rate of 1 ml/min. Scale bars, 100 μm. (C,D) ENDOU+ and CGB+ cells were quantified in 3D tissues under dynamic and static conditions. The data are indicated as mean ± SEM (n > 3). (E) qRT-PCR analyses were performed to detect the STB-related markers (listed in figure) under static and dynamic conditions. (F) Western blot revealed more STB marker expressions under dynamic conditions compared with those found in hiPSCs and static conditions. (G) Immunofluorescent images indicated HLA-G expression under dynamic conditions. Scale bar = 100 μm. (H) HLA-G+ was quantified in 3D cultures under different conditions. The data are indicated as mean ± SEM (n > 3). (I) EVT-related markers (listed previously) were detected by qRT-PCR. GAPDH was used as the reference gene. Data were mean ± SEM (n = 3). The data were analyzed using Student’s t-test (*p < 0.05, **p < 0.01, and ***p < 0.001). Scale bars, 100 μm.

