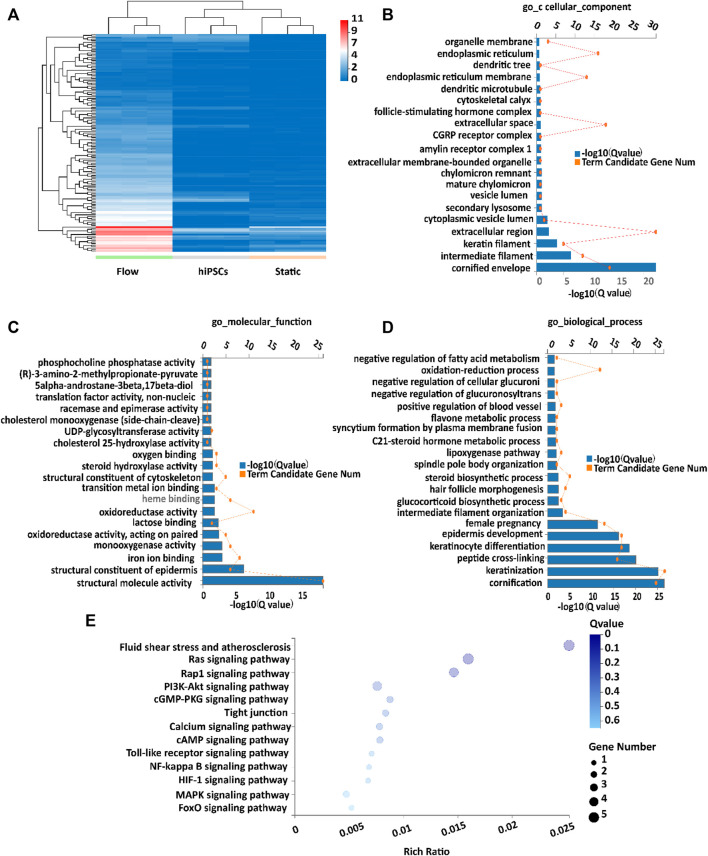
FIGURE 5.
Transcriptome analysis of placental trophoblast-like tissues under static and dynamic conditions. (A) Hierarchical clustering heatmap of upregulated DEGs in the flow group compared with the static group, the undifferentiated hiPSC group. (B–D) GO enrichment of upregulated DEGs according to the (B) cellular component, (C) molecular function, and (D) biological process. (E) KEGG analysis of upregulated DEGs in 3D tissues under dynamic conditions compared with static conditions.

