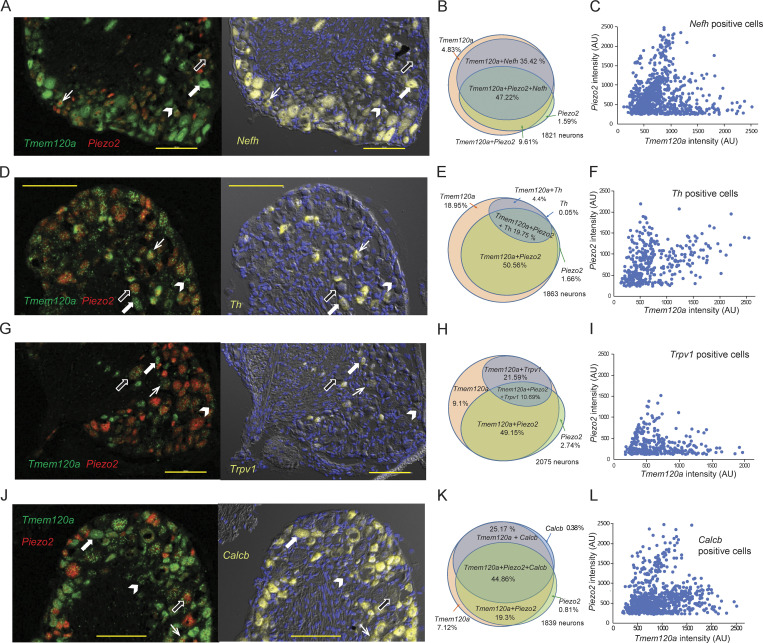
Figure 3.
Tmem120a and Piezo2 are coexpressed in various DRG populations. RNAScope fluorescence in situ hybridization on mouse DRGs was performed as described in the methods section, with probes for Tmem120a, Piezo2, and four different neuronal markers. The data represent three independent DRG preparations, and two to three slices per condition for each preparation. Arrows in representative images show cells that express: Tmem120a and neuronal marker (white wide arrow), Tmem120a and Piezo2 and neuronal marker (white arrow), Tmem120a (arrowhead), and Tmem120a + Piezo2 (black wide arrow). Horizontal yellow lines indicate 100 μm on each image. (A) Left panel: Representative image for DRGs labeled with Tmem120a (green) and Piezo2 (red). Right panel: The same section labeled with Nefh (yellow). The section was also stained with DAPI to label nuclei. (B) Venn diagram showing coexpression of Tmem120a, Piezo2, and Nefh. (C) Intensity of Piezo2 labeling as a function of Tmem120a signal for individual cells that was positive for Nefh. For both Tmem120a and Piezo2, cells that were below the threshold for counting as positive for Tmem120a or Piezo2 are not shown. (D) Representative images for DRGs labeled with Tmem120a (green) and Piezo2 (red) and Th (yellow). (E) Venn diagram showing coexpression of Tmem120a, Piezo2, and Th. (F) Intensity of Piezo2 labeling as a function of Tmem120a signal for individual cells that were positive for Th. (G) Representative images for DRGs labeled with Tmem120a (green) and Piezo2 (red) and Trpv1 (yellow). (H) Venn diagram showing coexpression of Tmem120a, Piezo2, and Trpv1. (I) Intensity of Piezo2 labeling as a function of Tmem120a signal for individual cells that were positive for Trpv1. (J) Representative images for DRGs labeled with Tmem120a (green) and Piezo2 (red) and Calcb (CGRP2; yellow). (K) Venn diagram showing coexpression of Tmem120a, Piezo2, and Calcb. (L) Intensity of Piezo2 labeling as a function of Tmem120a signal for individual cells that was positive for Calcb. AU, arbitrary units.

