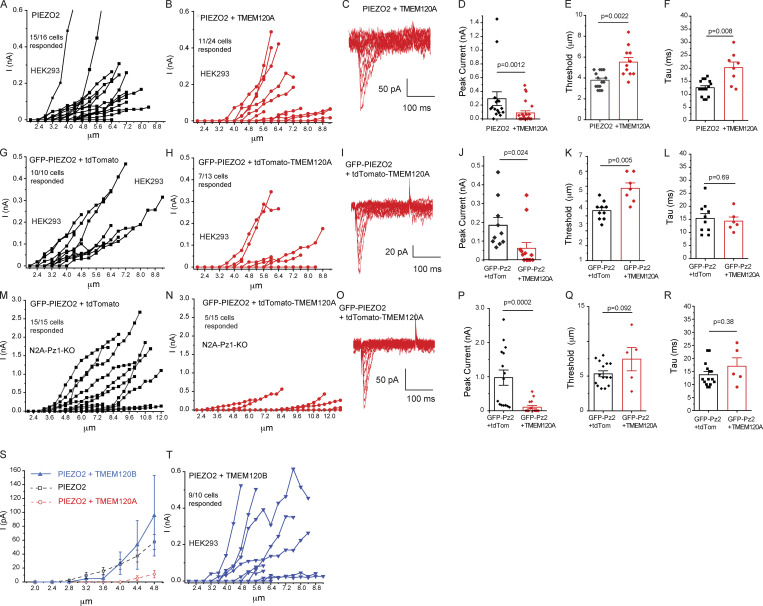
Figure S1.
TMEM120A but not TMEM120B inhibits PIEZO2 currents. Data from Fig. 1 showing the full range of measurements with indentation depth increased until seals were lost. (A and B) Data from HEK293 cells transfected with Piezo2 and Tmem120A. (C) Representative traces for increasing indentation depth till 7.2 μm. (D) Peak current amplitudes regardless of indentation depth. (E) Mechanical threshold of responding cells. (F) Inactivation time constant (tau). (G and H) Data from HEK293 cells transfected with GFP-Piezo2 and tdTomato-Tmem120A. (I) Representative traces for indentation depths till 8.4 μm. (J) Peak current amplitudes regardless of indentation depth. (K) Mechanical threshold of responding cells. (L) Inactivation time constant (tau). (M and N) Data from Piezo1 deficient N2A cells transfected with GFP-Piezo2 and tdTomato-Tmem120A. (O) Representative traces for indentation depths till 11.6 μm. (P) Peak current amplitudes regardless of indentation depth. (Q) Mechanical threshold of responding cells. (R) Inactivation time constant (tau). (S) Whole-cell patch-clamp data from HEK293 cells transfected with Piezo2 and Tmem120B, mean ± SEM of current amplitudes as a function of indentation depth. For PIEZO2 alone and PIEZO2 + TMEM120A data were replotted from Fig. 1 (dashed lines). (T) Data for full the range of indentations. Statistical significance was calculated with two-sample t test (F, K, L, and Q) or Mann-Whitney test (D, E, J, P, and R). Data are shown as mean ± SEM and scatter plots.

