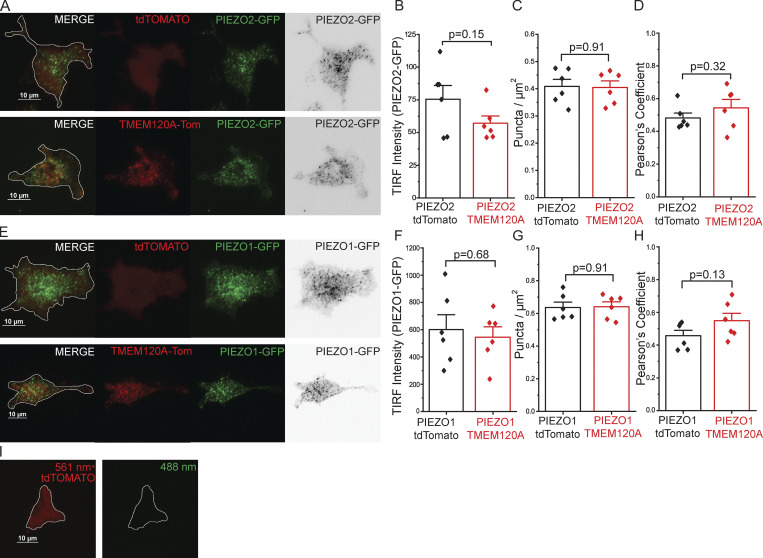
Figure S3.
TMEM120A shows only weak colocalization with PIEZO1 or PIEZO2, and does not change their cell-surface expression. TIRF microscopy was performed as described in the Materials and methods section. (A) Representative TIRF images for HEK293 cell transfected with tdTomato-Tmem120a and GFP-Piezo2 (bottom) and tdTomato and GFP-Piezo2 (top). (B) Summary data for the fluorescence intensity for GFP-PIEZO2 in the TIRF mode for cells cotransfected with tdTomato or tdTomato-Tmem120a. (C) Number of GFP-PIEZO2 puncta per μm. (D) Pearson’s coefficient for colocalization of tdTomato-TMEM120A with GFP-PIEZO2 and tdTomato with GFP-PIEZO2. (E) Representative TIRF images for HEK293 cell transfected with tdTomato-Tmem120a and GFP-Piezo1 (bottom) and tdTomato and GFP-Piezo1 (top). (F) Summary data for the fluorescence intensity for GFP-PIEZO1 in the TIRF mode for cell cotransfected with tdTomato or tdTomato-Tmem120a. (G) Number of GFP-PIEZO1 puncta per μm. (H) Pearson’s coefficient for colocalization of tdTomato-TMEM120A with GFP-PIEZO1 and tdTomato with GFP-PIEZO1. (I) Representative image of cell expressing only tdTomato with 561-nm laser (left) and 488-nm laser (right). Bar graphs show mean ± SEM and scatter plots. Individual symbols show the average value of cells for one coverslip (5–22 cells/coverslip) from two independent transfection. Statistical significance was calculated with two-sample t test.

