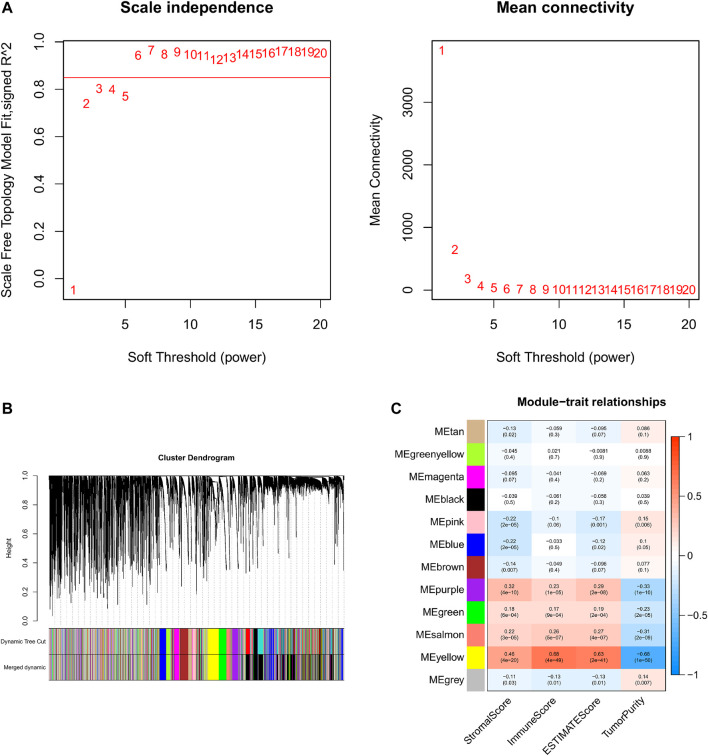
FIGURE 4.
WGCNA and identification of the TME score-related module. (A) Analyses of the appropriate soft threshold power and minimum mean connectivity to construct topological overlap matrix (TOM). (B) Clustering dendrograms of the co-expression network modules. (C): The correlation analysis between the TME score and module, correlation coefficient, and p-values are shown.

