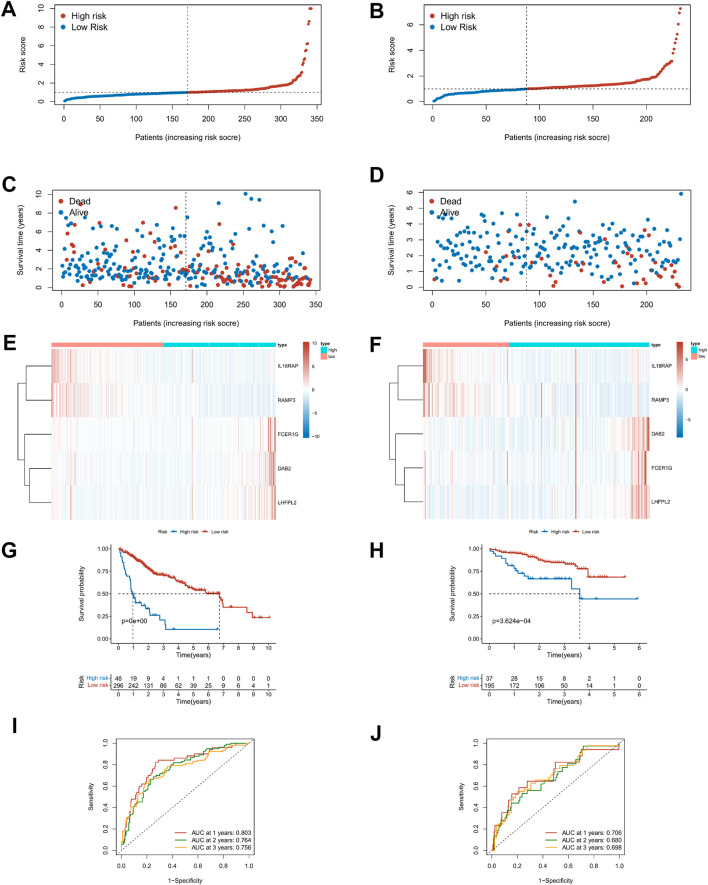
FIGURE 6.
Prediction performances of risk signature in the training (TCGA, left) and validation cohorts (ICGC, right). (A–D) Distribution of risk scores and survival status in patients with HCC. (E,F) Heat maps of five-gene expression profiles in the high- and low-risk groups. (G,H) The K–M survival curves analysis in high‐ and low‐risk groups. (I,J) The time-dependent ROC curve analysis of TME risk signature for predicting 1-, 3-, and 5-year survival sensitivity.

