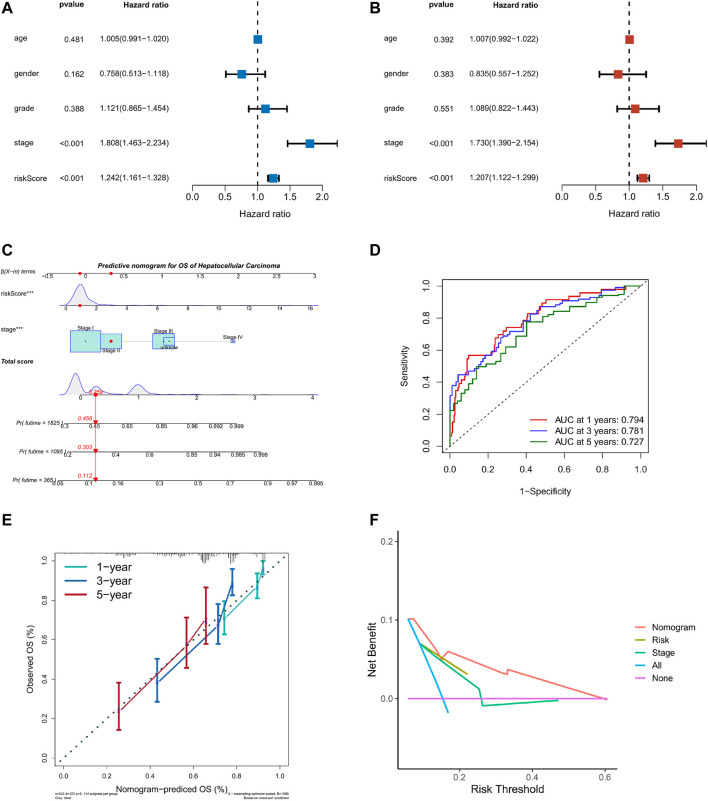
FIGURE 7.
Nomogram of TME risk signature to predict HCC patients’ survival. (A,B) Forest maps of the univariate and multivariate Cox regression analysis, including risk score, age, gender, grade, and stage. (C) A nomogram, consisting of risk score and stage for predicting 1-, 3-, and 5-year survival for HCC patients. (D) The time-dependent ROC curve analysis indicated that the nomogram was a reliable and stable predictor for OS at 1-, 3-, and 5-years. (E) The calibration curve showed the nomogram’s predicted (x-axis) and actual survival probabilities (y-axis). (F) The DCA analysis evaluating the clinical utility of the nomogram.

