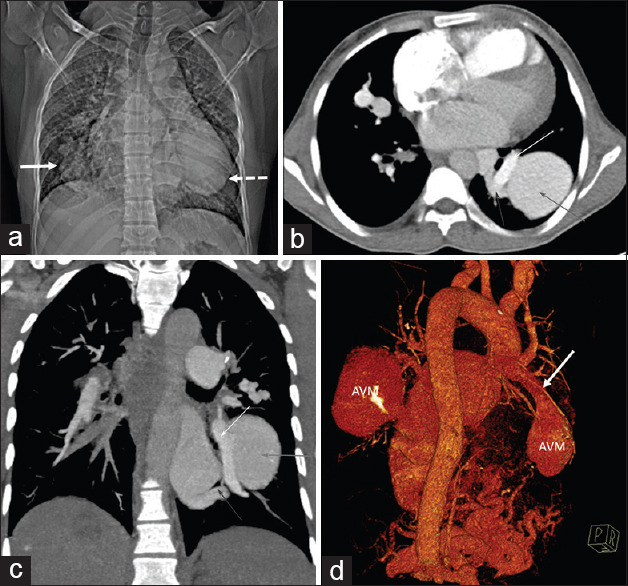
Figure 2.

(a) Computed tomography topogram image showing lobulated oval density in the right lower zone paracardiac region (white arrow). Another larger ovoid density is seen in the left retrocardiac region (dashed arrow). (b) Computed tomography pulmonary angiogram image showing the typical appearance of arteriovenous malformation, with a large feeding vessel arising from the pulmonary artery (yellow arrow) and an adjacent draining vein (blue arrow), entering and exiting the malformation arteriovenous malformation (red arrow). (c) Coronal maximum intensity projection contrast-enhanced computed tomography images depicting large simple arteriovenous malformations (red arrows) with feeding artery from the right lower lobe segmental pulmonary artery (yellow arrow) and draining through the right inferior pulmonary vein (blue arrow). (d) Computed tomography volume-rendered image showing the bilateral arteriovenous malformation, with a large feeding vessel arising from the pulmonary artery (white arrow) entering the malformation arteriovenous malformation
