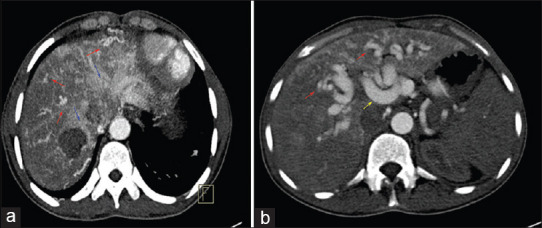
Figure 3.

(a) Axial contrast-enhanced early arterial phase computed tomography abdomen image depicts inhomogeneous attenuating pattern within the liver parenchyma with multiple telangiectases (red arrow), large confluent vascular mass (blue arrow). (b) Computed tomography abdomen depicting multiple telangiectases (red arrow) and dilated hepatic artery (yellow arrow)
