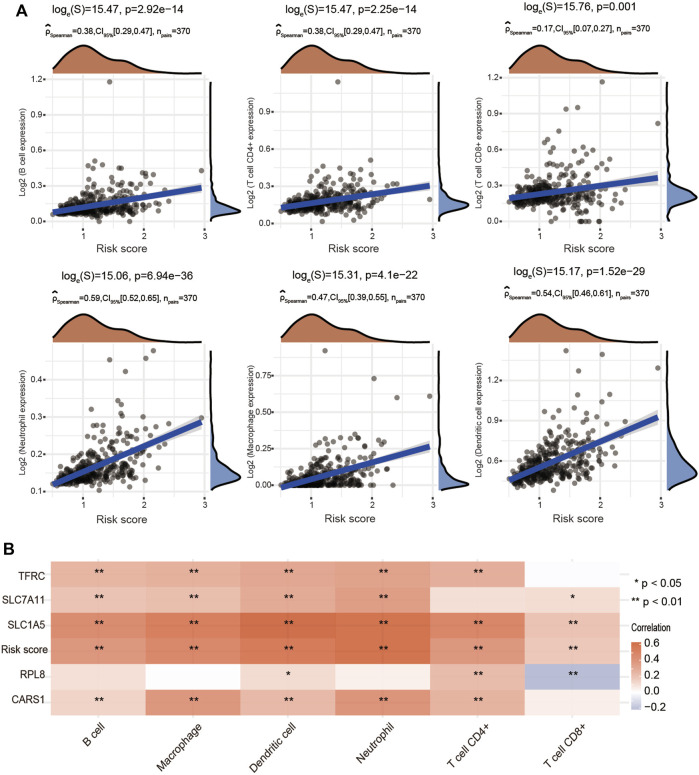
FIGURE 10.
Positive association of the risk score with immune cell infiltration in HCC. (A) Correlations between the risk score and the infiltration levels of B cells, CD4+ T cells, CD8+ T cells, macrophages, neutrophils and dendritic cells using the spearman analysis. (B) Heatmap showing the correlation between risk score and five ferroptosis-related genes and the infiltration levels of six major immune cells. Red represents a positive correlation and blue represents a negative correlation. *p < 0.05, **p < 0.01.

