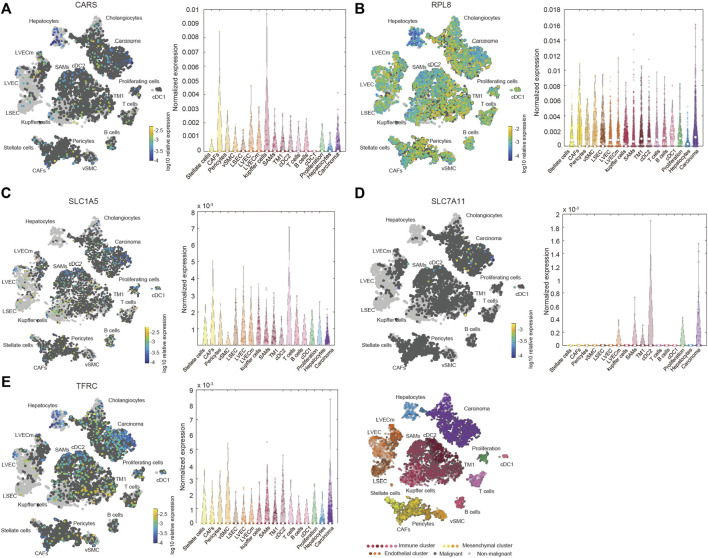
FIGURE 6.
Increased expression and distribution of CARS1 (A), RPL8 (B), SLC1A5 (C), SLC7A11 (D) and TFRC (E) in HCC according to single-cell RNA-seq analysis using the Human Liver Browse database (https://itzkovitzwebapps.weizmann.ac.il/webapps/home/session.html?app=HumanLiverBrowser). The left tSNE plots show the expression of 5 FRGs in 17 Seurat clusters. The identified clusters are represented by different colors. The light grey dots represent non-malignant cells (normal liver cells), the dark grey dots represent the malignant cells (HCC cells), and the different color dots represent the immune cluster, mesenchymal cluster and endothelial cluster. The right panel shows the normalized expression of each gene in different cells.

