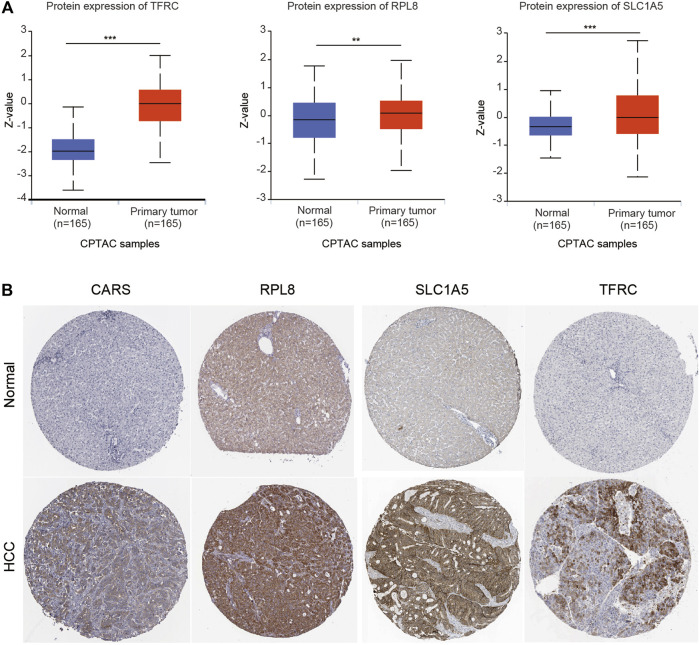
FIGURE 7.
Higher protein expression of FRGs in HCC tissues than in normal liver tissues. (A) The protein expression of TFRC, RPL8 and SLC1A5 in HCC tissues and normal tissues was investigated in the CPTAC database. Z-values represent standard deviations from the median across samples for HCC. (B) Immunohistochemistry analysis was used to examine the protein expression levels of SLC1A5, TFRC, RPL8 and CARS1 in the HPA database. *p < 0.05, **p < 0.01, ***p < 0.001.

