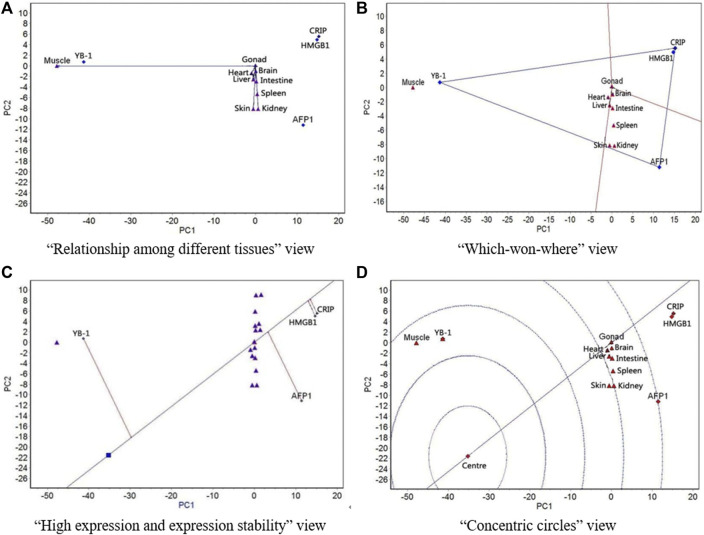
FIGURE 5.
The GGE biplot for expression of four resistance genes to low temperature (AFP1, CIRP, YB-1, and HMGB1) in different tissues at 18°C. (A) “Relationship among different tissues” view. (B) “Which-won-where” view. (C) “High expression and expression stability” view. (D) “Concentric circles” view.

