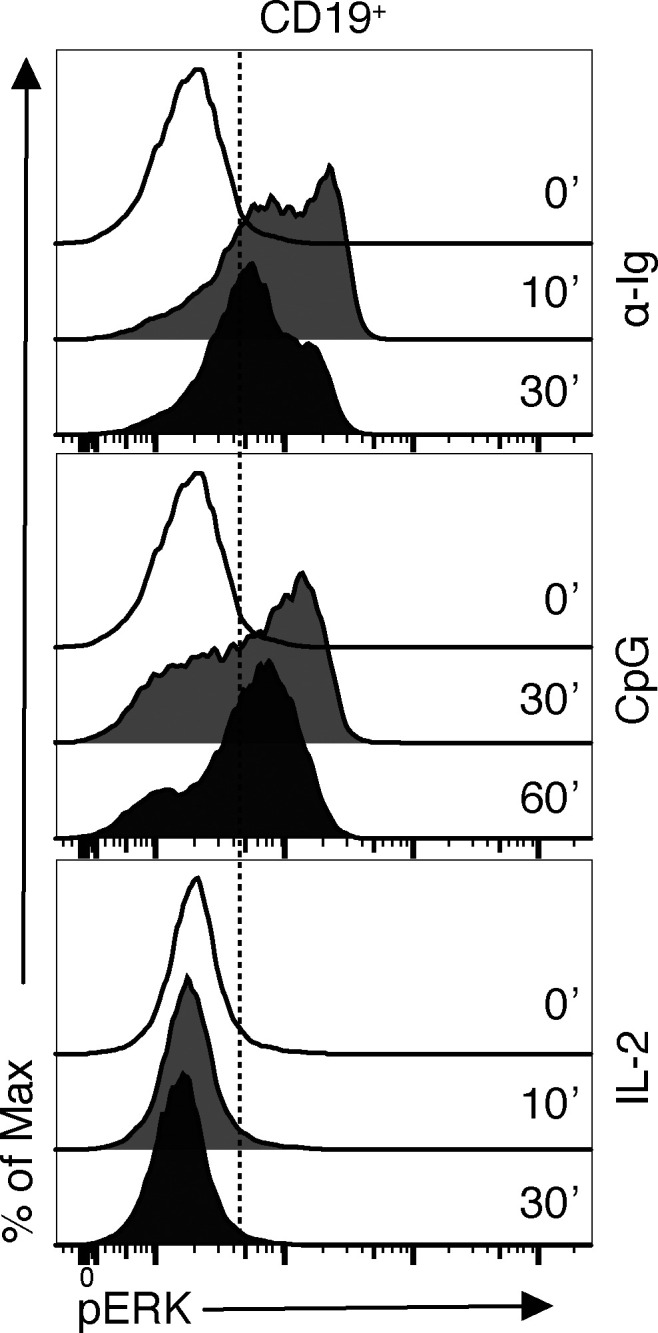
Figure S1.

pERK expression kinesis with different stimulations in PB B cells. FACS histogram shows pERK expression in PB B cells in unstimulated (0 min) state and after different stimulations at different time points: α-Ig (10 and 30 min); CpG (30 and 60 min); IL-2 (10 and 30 min).
