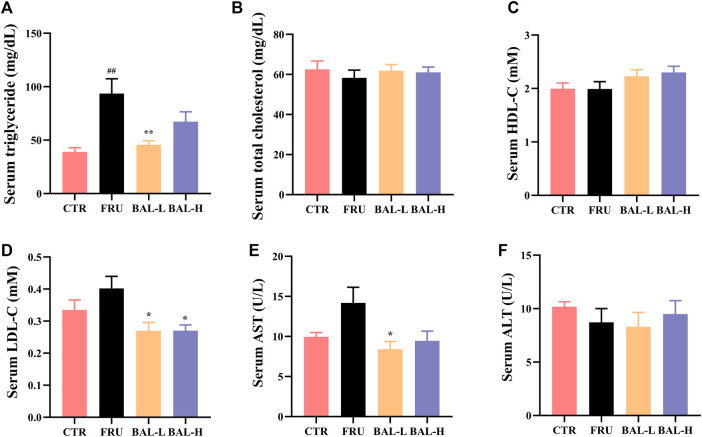
FIGURE 1.
The serum biochemical indexes of rats during BAL treatment. (A) Serum TG. (B) Total TC in serum. (C) HDL-C in serum. (D) Serum LDL-C. (E) Serum level of AST. (F) ALT level in serum. Data were represented as Mean ± SEM (n ≥ 6/group), ## p < 0.01, # p < 0.05, compared with CTR; **p < 0.01, *p < 0.05, compared to FRU.

