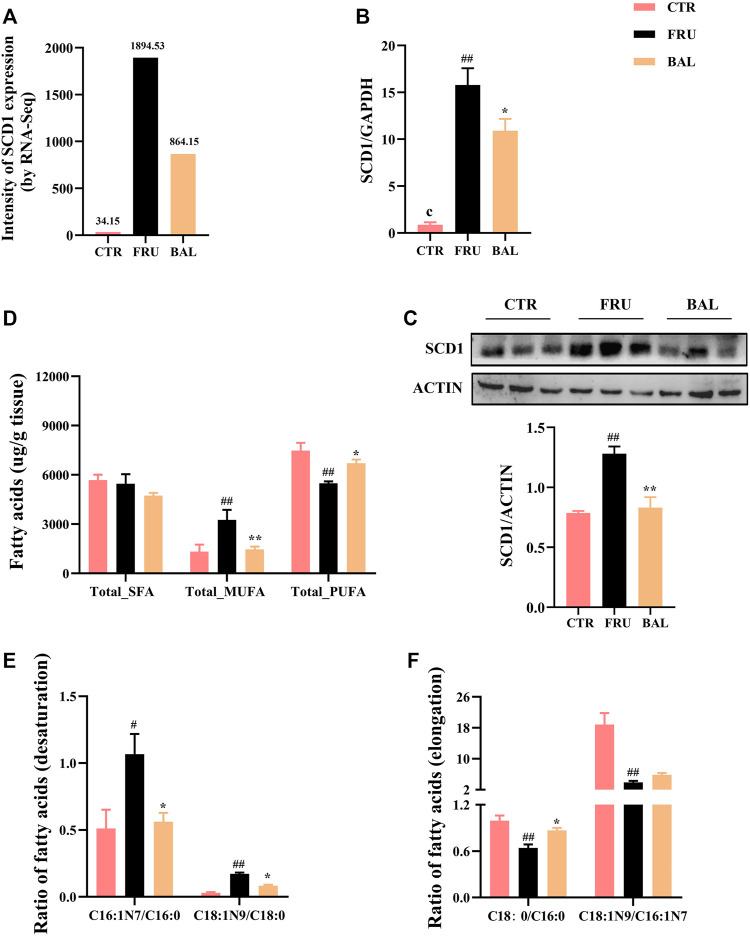
FIGURE 4.
Effects on hepatic fatty acid composition and SCD1 expression caused by BAL treatment in fructose-fed rats. (A) SCD1 expression by RNA-sequencing analysis. (B) SCD1 mRNA level. (C) SCD1 expression in protein level. (D) Total of SFA, MUFA and PUFA in rat liver. (E) SCD1 activity. (F) ELOVL6 activity. Data were represented as Mean ± SEM (n = 6/group), ## p < 0.01, # p < 0.05, compared with CTR; **p < 0.01, *p < 0.05, compared to FRU.

