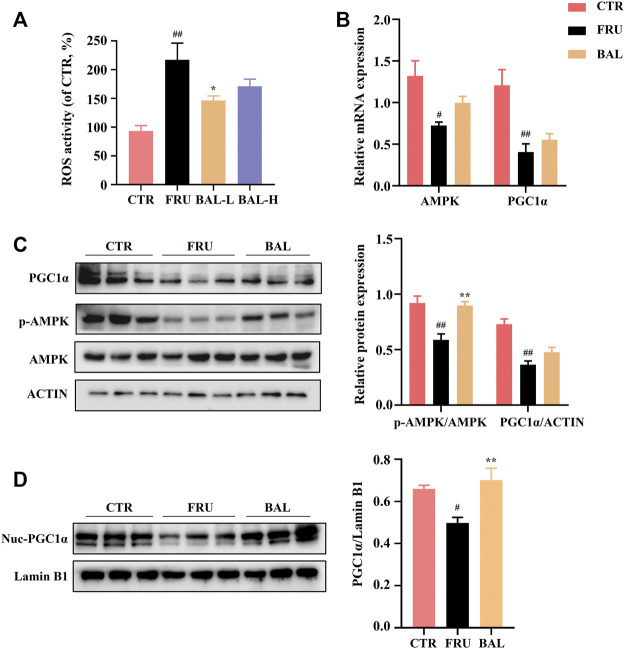
FIGURE 7.
Effects of hepatic ROS and AMPK-PGC1α pathway by BAL treatment in fructose-fed rat liver. (A) ROS activity in rat liver. (B) mRNA level of AMPK and PGC1α. (C) PGC1α expression and AMPK phosphorylation level (Thr 172). (D) The nuclear expression of PGC1α. Data were represented as Mean ± SEM (n = 6/group), ## p < 0.01, # p < 0.05, compared with CTR; **p < 0.01, *p < 0.05, compared to FRU.

