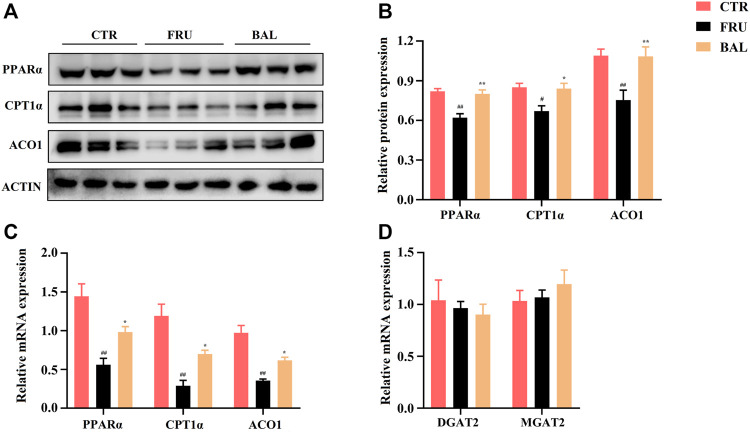
FIGURE 8.
Effects of BAL treatment on PPARα elicited fatty acids oxidation pathway and the key enzymes’ (DGAT2 and MGAT2) levels in triglyceride synthesis of fructose-fed rat liver. (A,B) Protein expressions of ACO1, CPT1α and PPARα by western-blot analysis. (C) FAO associated genes expressions of PPARα, CPT1α and ACO1. (D) mRNA levels of DGAT2 and MGAT2. Data were represented as Mean ± SEM (n = 6/group), ## p < 0.01, # p < 0.05, compared with CTR; **p < 0.01, *p < 0.05, compared to FRU.

