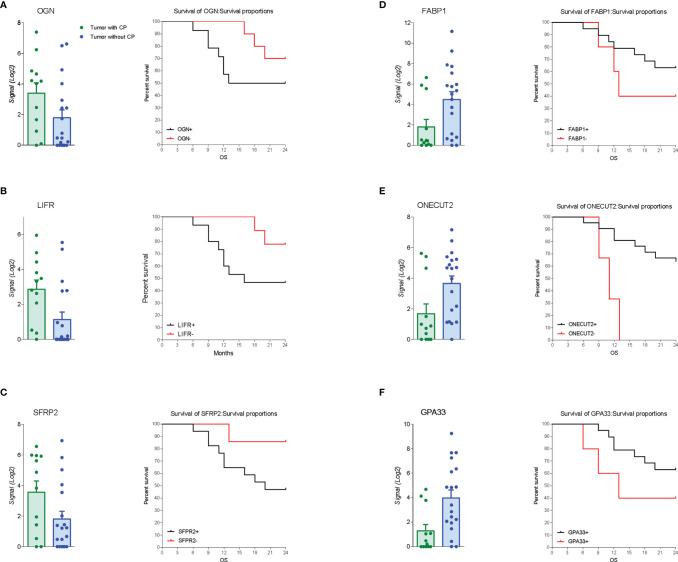
Figure 3.
Gene expression and survival curve. Left panel: Relative mRNA expression levels extract from RNA-seq analysis and overall survival of patients according to up regulated genes expression of (A) OGN, (B) LIFR, and (C) SFRP2. Right panel: Relative mRNA expression levels extract from RNA-seq analysis and overall survival of patients according to down regulated genes expression of (D) Fabp1, (E) Onecut2, and (F) Gpa33.

