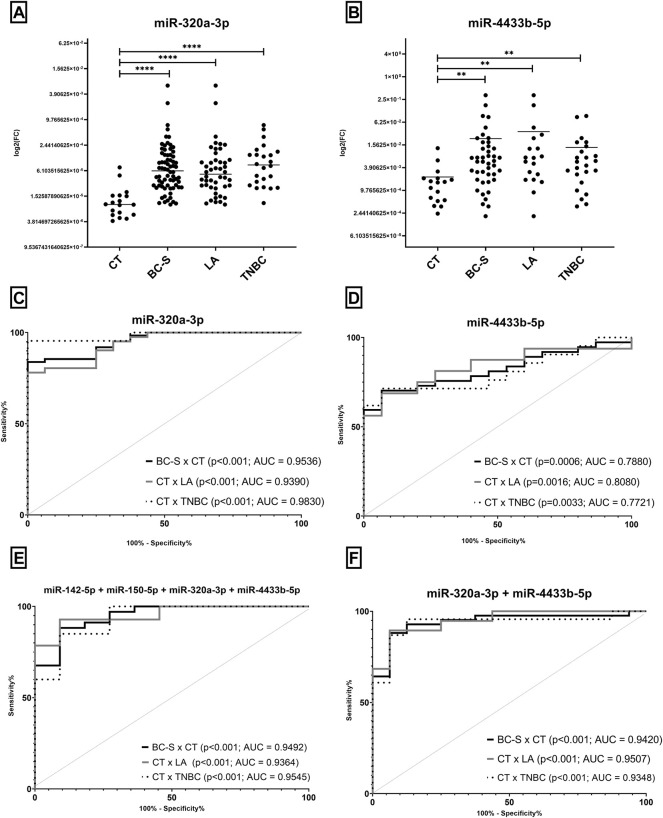
FIGURE 1.
Expression levels of miRNAs by RT-qPCR in serum samples and potential of cf-miRNAs to discriminate BC and subtypes (LA and TNBC) from CT. Expression levels of miRNAs (A) miR-320a-3p and (B) miR-4433b-5p in BC-S and subtypes (LA and TNBC) and CT. After outlier removal, each dot represents one sample. ROC curves for BC-S diagnosis and prognosis in Brazilian samples (C–F), comparing BC-S to CT (black), CT to LA (gray), and CT to TNBC (dotted). ROC curves were performed to evaluate miR-320a-3p (C) or miR-4433b-5p (D) individually (F) or in combination with all miRNAs in a completed panel (E). ROC = receiver operating characteristic; AUC, area under the curve; CT, serum controls; BC-S, breast cancer serum samples; LA, luminal A; and TNBC, triple-negative breast cancer. (**) p = 0.001 and (****) p < 0.0001.

