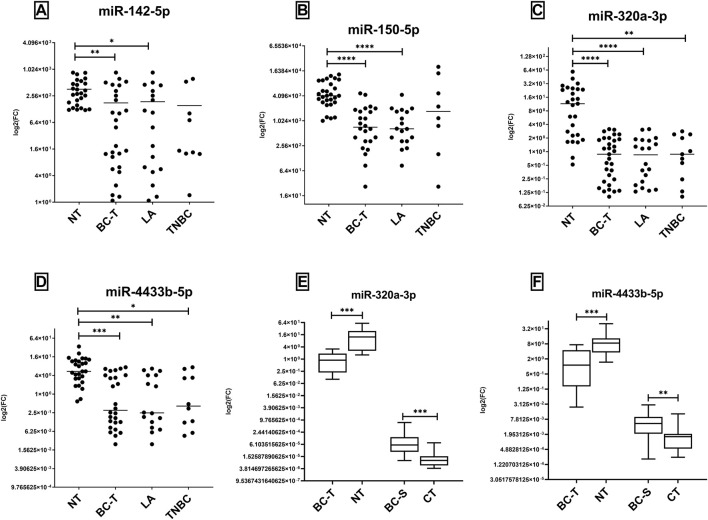
FIGURE 2.
Expression levels of miR-142-5p, miR-150-5p, miR-320a, and miR-4433b-5p on fresh tissue samples. miR-142-5p, miR-150-5p, miR-320a, and miR-4433b-5p evaluated by RT-qPCR in tissue samples (A–D), and the comparison between serum and tissue expression in matched samples (E,F). (A–D) Levels of expression were evaluated in NT and BC-T samples; BC-T samples comprised LA and TNBC subtypes, and the expression of all miRNAs was evaluated. After outlier removal, each dot represents one sample in the tissue group. NT samples showed overexpression of all miRNAs evaluated compared to BC-T (A) and LA samples. (E,F) BC-S and BC-T were evaluated as matched pairs from patients with both samples to all miRNAs (n = 16). NT and CT were also compared but not paired. Inverse directions were found between miRNA expression comparing BC-S (high) and BC-T (low). BC-T, breast cancer tissue samples; NT, non-tumor samples; BC-S, breast cancer serum samples; LA, luminal A; TNBC, triple-negative breast cancer; and CT, controls. (*) p = 0.01; (**) p = 0.001; (***) p = 0.0001; and (****) p < 0.0001.

