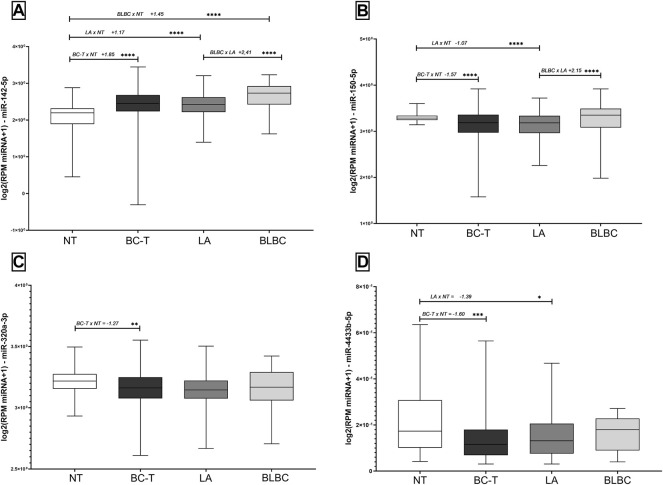
FIGURE 4.
Expression levels of miR-142-5p, miR-150-5p, miR-320a-3p, and miR-4433b-5p in tissue samples according to the TCGA database. Expression levels of (A) miR-142-5p, (B) miR-150-5p, (C) miR-320a-3p, and (D) miR-4433b-5p in BC-T and subtypes (LA and BLBC) and NT. Fold change between the two groups compared and the order of comparisons were indicated before the FC and p values. NT, non-tumor samples; BC-T, breast cancer tissue samples; LA, luminal A; BLBC, basal-like breast cancer; and FC, fold change. (*) p < 0.01; (**) p = 0.001; (***) p = 0.0001; and (****) p < 0.0001.

