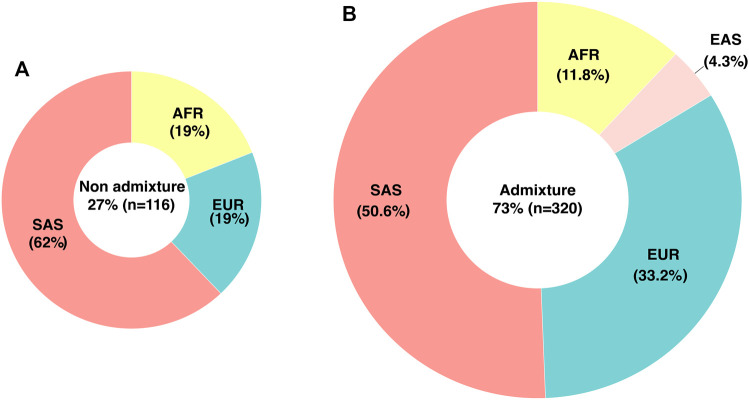
FIGURE 1.
Genetic ancestry and admixture in the studied population determined by WES. (A) Percentage and distribution of individuals classified as non-admixed (B) Percentage and ancestry contribution of individuals classified as admixed. EUR, European; AFR, African; SAS, South Asian; EAS, East Asian.

