
TABLE 2.
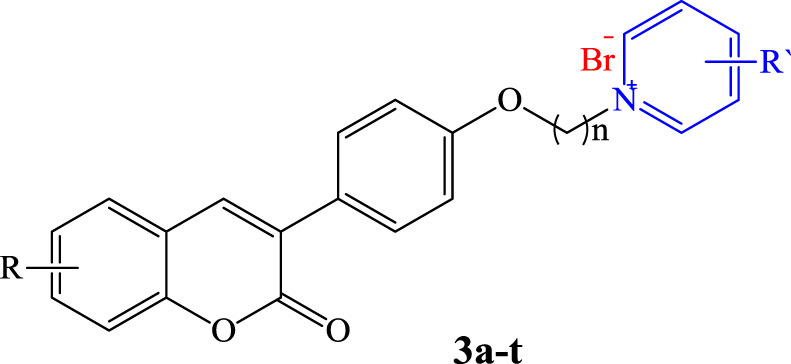
The protective effect of compounds 3a, 3b, 3f, 3g, 3l, and 3t against H2O2 (150 μM)-induced injury in the PC12 cell line at different concentrations in comparison to Quercetin a .
| ||||||||||
| Compound | n | R | R′ | PC12 cell viability (% of control) | ||||||
| H 2 O 2 | 0.1 μM | 1 μM | 5 μM | 10 μM | 20 μM | 50 μM | ||||
| 3a | 3 | H | H | 26.7 ± 0.8 | 39.4 ± 1.7 | 42.2 ± 1.3 | 53.6 ± 1.4 | 55.6 ± 0.1 | 57.4 ± 0.4 | 58.3 ± 1.4 |
| 3b | 3 | 6-OMe | H | 26.2 ± 0.2 | 31.7 ± 1.4 | 37.6 ± 1.1 | 43.3 ± 0.9 | 45.4 ± 1.3 | 49.6 ± 0.9 | 54.3 ± 1.6 |
| 3f | 3 | 6-NO2 | H | 25.4 ± 1.5 | 34.1 ± 1.0 | 42.8 ± 1.4 | 43.1 ± 1.5 | 45.0 ± 0.8 | 48.3 ± 0.4 | 50.8 ± 0.6 |
| 3g | 4 | H | H | 25.5 ± 0.7 | 30.2 ± 1.4 | 33.6 ± 1.2 | 36.6 ± 0.9 | 45.8 ± 0.3 | 48.7 ± 0.9 | 49.9 ± 0.9 |
| 3l | 4 | 6-NO2 | H | 23.5 ± 1.0 | 23.7 ± 0.5 | 27.3 ± 1.2 | 33.5 ± 1.2 | 37.8 ± 1.0 | 51.6 ± 1.1 | 55.7 ± 2.0 |
| 3t | 3 | 6-NO2 | 4-Dimethylamine | 22.9 ± 0.7 | 38.3 ± 0.9 | 45.3 ± 0.7 | 53.6 ± 0.7 | 56.3 ± 1.6 | 68.2 ± 0.1 | 71.8 ± 1.1 |
| Quercetin | — | — | — | 28.0 ± 0.8 | 37.7 ± 1.2 | 44.2 ± 0.7 | 50.7 ± 0.1 | 55.8 ± 0.3 | 59.6 ± 0.8 | 61.0 ± 0.8 |
a
Cell viability was determined using the MTT assay protocol. Data are expressed as the mean ± SEM of three independent replicates.