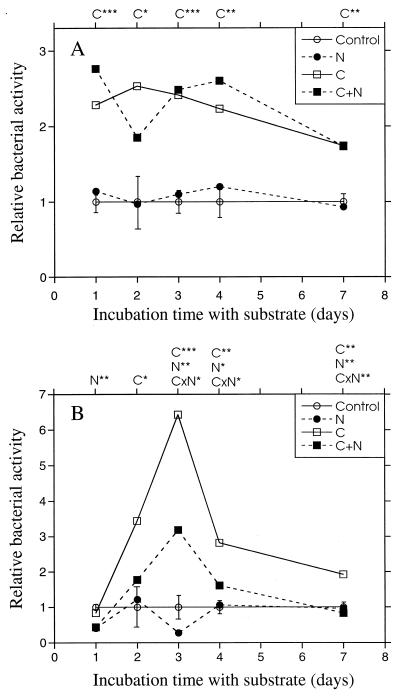
FIG. 2.
Relative bacterial activities (thymidine incorporation) at different times after the addition of C and N to the agricultural soil (A) and the forest humus (B). The activity of the nonamended control sample was set to 1. Bars indicate standard errors (SEs) (n = 2) obtained from ANOVA for each separate time. C, N, or CxN over the graph indicates significant effects of carbon, nitrogen, or the interaction of carbon and nitrogen. ∗, P < 0.05; ∗∗, P < 0.01; ∗∗∗, P < 0.001.

