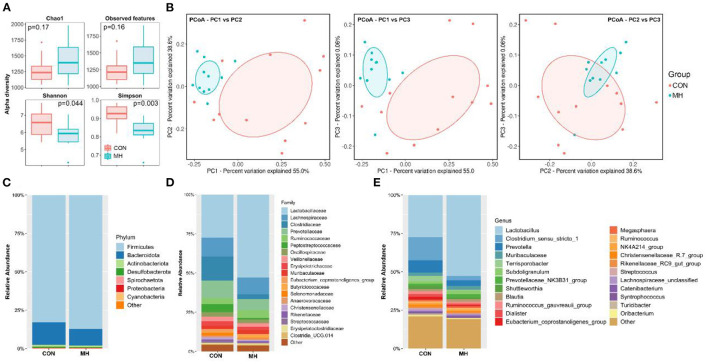
Figure 2.
Fecal microbiota richness and evenness, difference of microbiome structure on β-diversity, and relative abundance of microbiota at phylum, family, and genus level. (A) Comparison of α-diversity indices, (B) comparison of β-diversity based on Principal coordinate analysis (PCoA), relative abundances at (C) phylum (D) family, and (E) genus levels. CON = basal diet without any additives, MH = basal diet + 8.3 × 10⁹ CFU/kg LM1, n =12 in the CON group, n =11 in the MH group.

