. 2022 Jun 13;1(4):719–730. doi: 10.1039/d2sd00076h

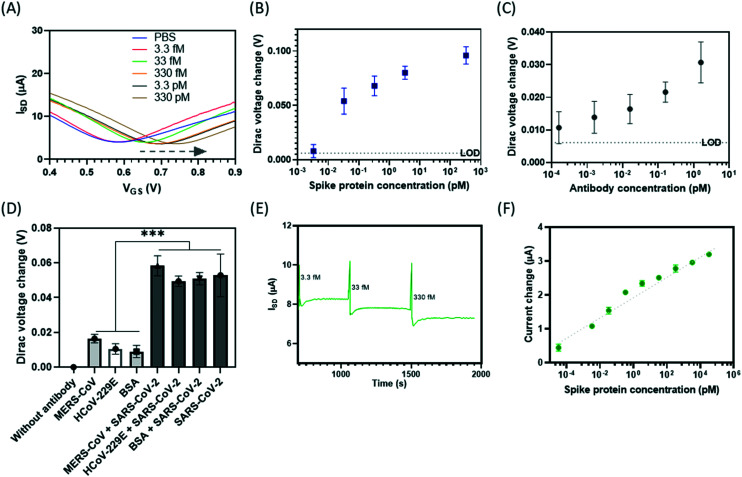
Fig. 4. Analytical performance assessment of the on-chip GFET sensing platform for SARS-CoV-2 spike protein detection: (A and B) sensitivity; (A) IV curves showing the Dirac point shift with an increasing spike protein concentration from 3.3 fM to 330 pM compared to the PBS (blank) sample; (B) calibration curves of Dirac voltage change against the spike protein concentration in the d1000 PBS buffering condition (y = 0.0069 ln(x) + 0.0657; R2 = 0.8433), where the LOD can be as low as 3 fM (103 proteins per μL) which is equal to 10–102 viruses per μL; (C) the serum testing using the on-chip GFET sensor (the detection of various concentrations of antibody dilutions) (n = 5); (D) the specificity test of spike protein antibodies against other non-target proteins using GFET sensors, where the bar chart shows the comparison of the change in Dirac point between the samples tested at 165 pM. n = 4; (E) the real-time monitoring of the source–drain current (ISD) change over time (s) in response to a series of spike protein concentrations, where VSD = 20 mV, VG = 0.65 V and the response time of the GFET sensor can be as fast as 100–150 s; (F) the change in current vs. the spike protein concentration.

Fig. 4