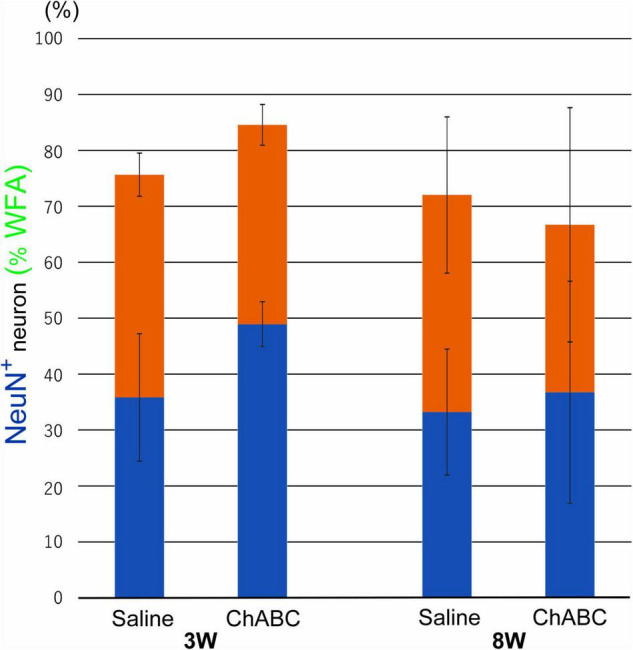
FIGURE 7.

Percentages of motoneurons whose cell bodies were covered with WFA-positive PNN structures among all motoneurons at 3 and 8 weeks after CST in rats with ChABC or saline administration. Blue bars indicate the percentage of motoneurons with > 80% WFA-positive structures, and red bars indicate the percentage of motoneurons with > 20% WFA-positive structures. Data are expressed as the mean ± SEM.
