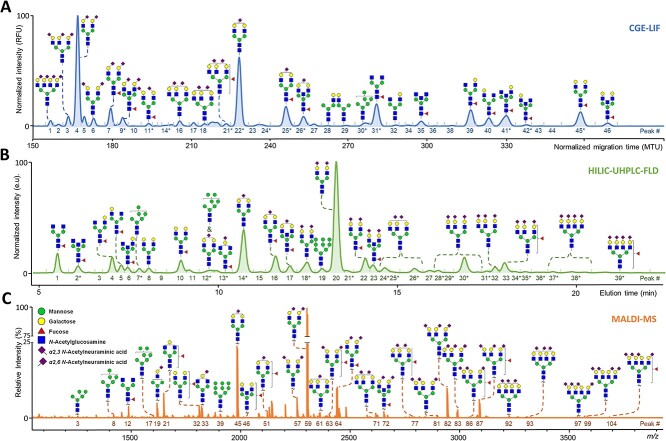
Fig. 1.
Total serum N-glycosylation profiles as obtained by HILIC–UHPLC–FLD, CGE–LIF, and MALDI–MS. A) Electropherogram by CGE–LIF after APTS labeling (Reiding et al. 2019). B) Chromatogram by HILIC–UHPLC–FLD after 2-AB labeling (Reiding et al. 2019; Zaytseva et al. 2020). C) Mass spectrum by MALDI–FT–ICR–MS after differential sialic acid esterification (Vreeker et al. 2018; Reiding et al. 2019). The m/z values of the assigned signals in C) correspond to [M + Na]+. HILIC–UHPLC–FLD and CGE–LIF can distinguish differences in branching (galactose arm, bisection, and fucose position). Structures are assigned based on exoglycosidase treatment and/or tandem MS data as well as literature knowledge on N-glycan biosynthesis. Some signals correspond to multiple glycan compositions for which the major one is assigned in the figure (CGE–LIF and HILIC–UHPLC–FLD). *For full assignments of each signal detected, see Supplemental Tables SI–SIII.

