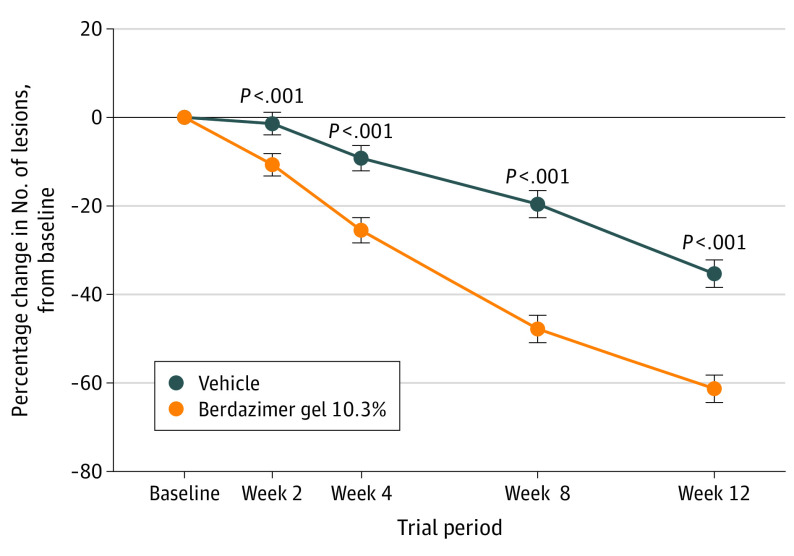
Figure 3. Molluscum Contagiosum Lesion Count, Mean Percent Change From Baseline to Week 12.
Data points are LS mean percent change in lesion count from baseline for the ITT population. Error bars indicate the standard error; P values for LS mean differences from vehicle (berdazimer gel to vehicle) are from mixed-model repeated-measures analyses with treatment, visit, treatment-by-visit interaction, investigator type (dermatologist vs other), household number of randomized patients (1 vs 2), baseline BOTE score (0 vs ≥1), age, and baseline lesion count as factors with an unstructured covariance matrix. BOTE denotes beginning-of-the-end; ITT, intention-to-treat, and LS, least-squares.

