
Figure 3. Association Between Early Source Control and 90-Day Mortality Across Prespecified Subgroups.
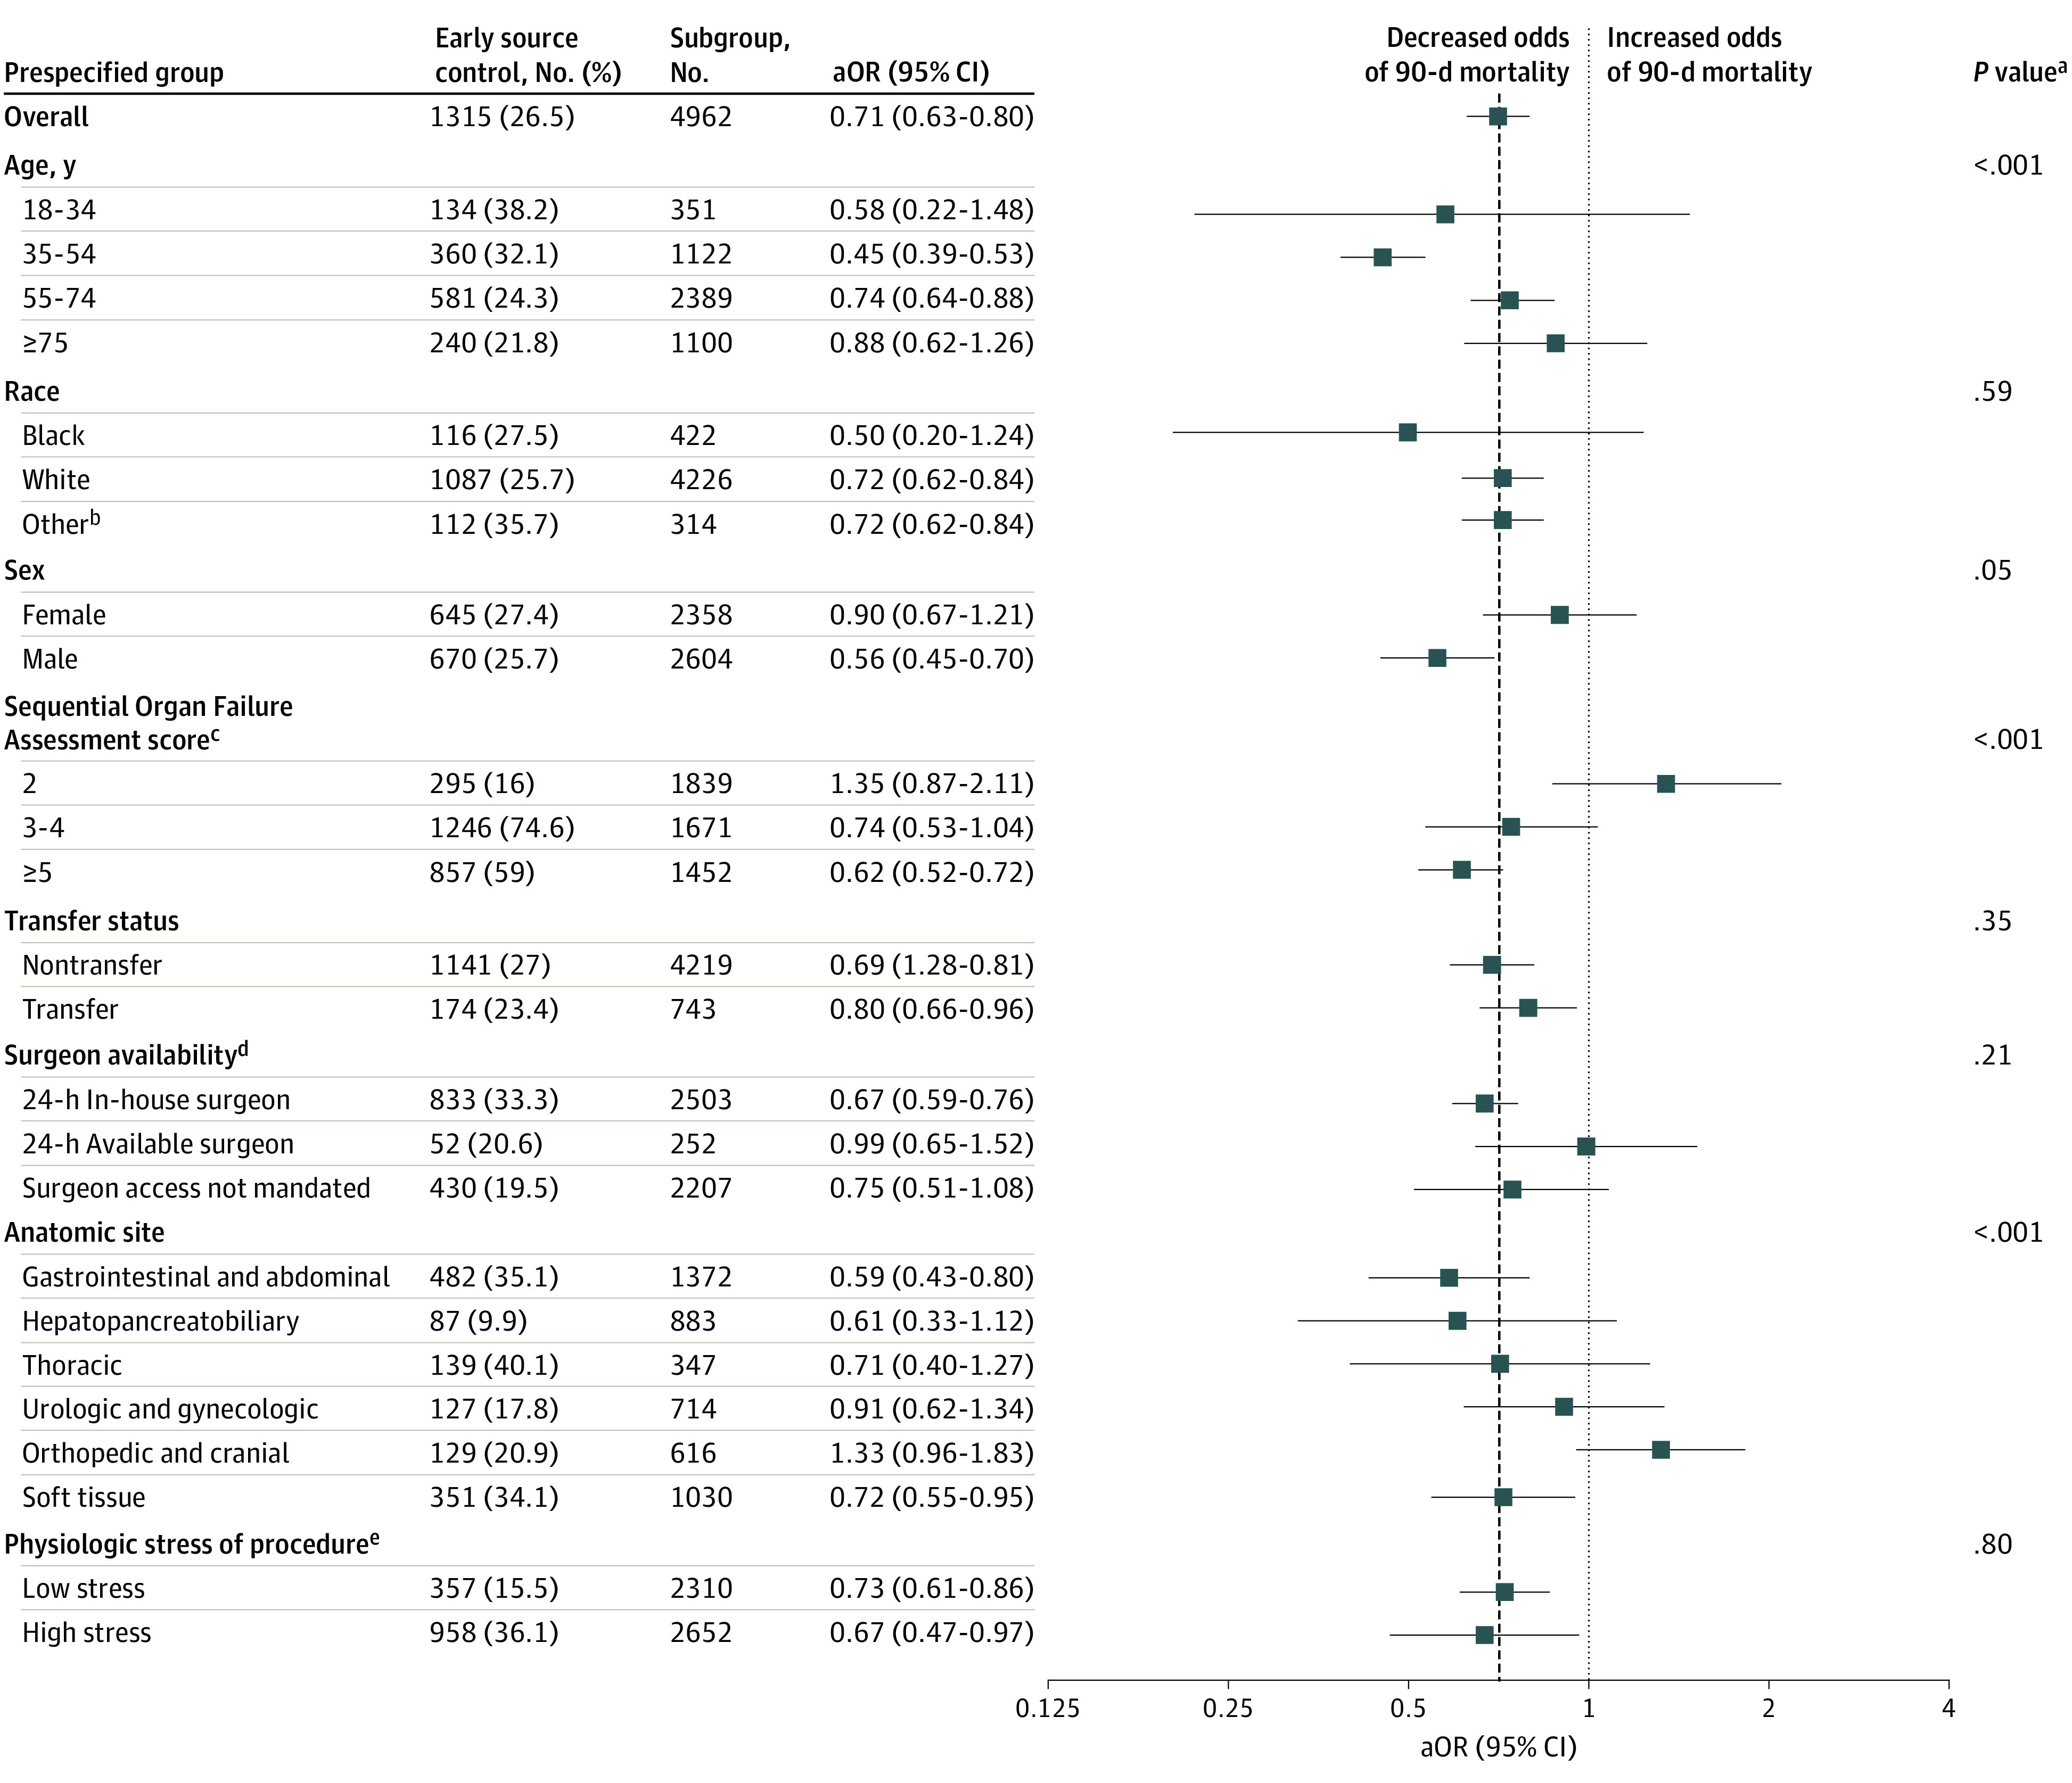
Risk-adjusted odds ratios (aORs) of 90-day mortality among prespecified subgroups. No difference in mortality among early or late source control is indicated by an aOR of 1.0, represented by the dotted line. The overall aOR of 90-day mortality associated with early source control is indicated by the dashed line.
aAll P values were calculated from the interaction between the treatment group and subgroups in the primary logistic regression model.
bOther race corresponds to American Indian/Alaska Native, Asian, Chinese, Filipino, Hawaiian/Other Pacific Islander, Middle Eastern, or Native American.
cScore corresponds to severity of organ dysfunction, reflecting 6 organ systems each with a score range of 0 to 4 points (cardiovascular, hepatic, hematologic, respiratory, neurological, renal), with a total score range of 0 to 24 points.
dSurgeon availability determined by the hospital-specific American College of Surgeons surgeon availability mandate (eTable 1 in the Supplement).
ePhysiologic stress was determined by Operative Stress Score (low <1; high 2-5). Procedures without an Operative Stress Score were assigned a physiologic stress level based on the rating of similar procedures (eTable 2 in the Supplement).