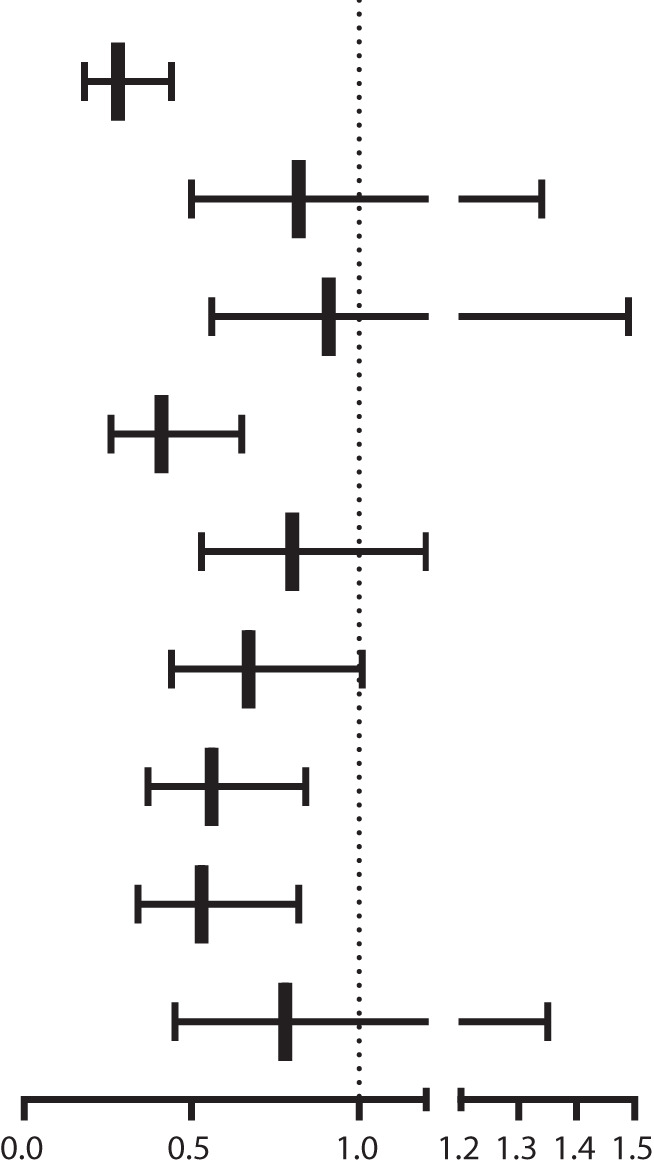
Table 3.
Multiple logistic regression models for the association of MAFLD related variables and osteoporosis.
| MAFLD related variables | N | Non-adjusted | Adjust I | Adjust II | |
|---|---|---|---|---|---|
| Overweight | 1499 | 0.23 (0.16, 0.33) | 0.22 (0.15, 0.33) | 0.28 (0.18, 0.44) |

|
| Diabetes | 605 | 0.59 (0.39, 0.90) | 0.65 (0.42, 1.01) | 0.82 (0.50, 1.34) | |
| Prediabetes | 480 | 0.87 (0.58, 1.31) | 0.71 (0.46, 1.11) | 0.91 (0.56, 1.49) | |
| Abdominal obesity | 1250 | 0.53 (0.38, 0.75) | 0.27 (0.18, 0.40) | 0.41 (0.26, 0.65) | |
| Hypertension | 1061 | 0.73 (0.52, 1.02) | 0.59 (0.41, 0.86) | 0.80 (0.53, 1.20) | |
| Hypertriglyceridemia | 1258 | 0.72 (0.51, 1.01) | 0.55 (0.38, 0.80) | 0.67 (0.44, 1.01) | |
| Low HDL | 1212 | 0.66 (0.47, 0.93) | 0.49 (0.34, 0.70) | 0.56 (0.37, 0.84) | |
| Hyper-hsCRP | 917 | 0.62 (0.43, 0.88) | 0.60 (0.41, 0.88) | 0.53 (0.34, 0.82) | |
| Insulin resistance | 479 | 0.56 (0.35, 0.89) | 0.64 (0.39, 1.05) | 0.78 (0.45, 1.35) |
Survey-weight adjusted multiple logistic regression model were used in this analysis. The adjust I was adjusted for age, sex,race/ethnicity, education, marital status. The adjust II was adjusted for dring habit, uric acid, Phosphorus, alkaline phosphatase,creatinine, alanine aminotransferase, copd, cancer, family history of osteoporosis, in addition to adjust I.
