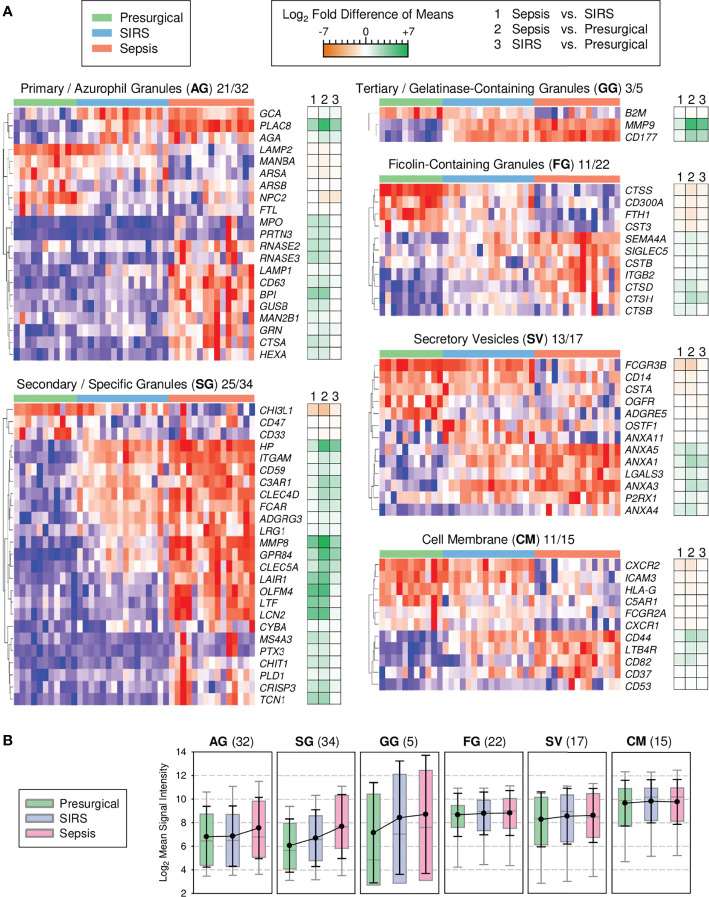
Figure 3.
Transcriptional signatures of granule biogenesis in discovery set CD15+ cells (presurgical, n = 11; SIRS, n = 16, sepsis, n = 15). (A) Heat maps for granule signature genes with differential expression by subcellular compartment. Following the two-letter abbreviations for the compartments, the numbers of the shown signature genes and the full numbers of signature genes per compartment are indicated. Tiles are arranged by patient group and genes are hierarchically clustered. Blue indicates the minimum and red maximum expression. Corresponding differences of means for the three patient group comparisons are displayed as accompanying dark orange-green heat maps. (B) Global granule signature gene expression. Patient group means for all signature genes (number in parentheses) are summarized as colored box plots with 5th and 95th percentiles (gray whiskers) and overlaid with the global averages as black dots with standard deviations (black whiskers).

