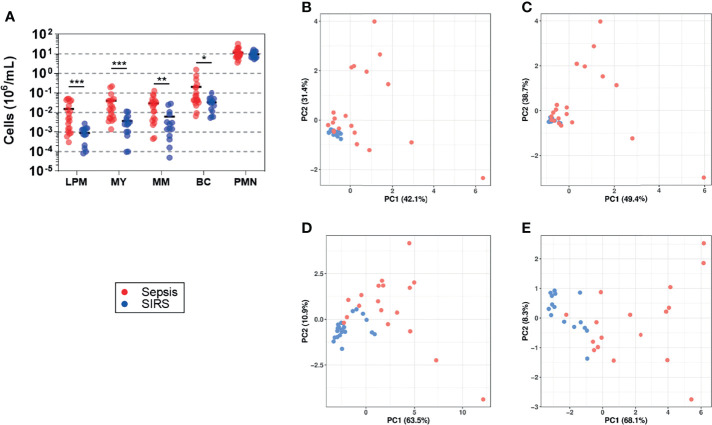
Figure 4.
Blood counts of granulocyte precursors (sepsis, n = 20; SIRS, n = 14). (A) Stages of terminal granulocytic differentiation were determined in whole blood by flow cytometry ( Supplementary Figure S1 ) (LPM, late promyelocyte; MY, myelocyte; MM, metamyelocyte; BC, band cell; PMN, polymorphonuclear neutrophil). Absolute counts per blood volume were determined using BD TruCount beads and are shown as scatter plots with horizontal black lines indicating group means. *** p < 0.0005; ** p < 0.005; * p < 0.05 after Mann–Whitney U test. PCA plots show the first two principal components (PC1 and PC2) corresponding to the CD15 cell count data shown in (A), either including (B) or excluding (C) PMNs and corresponding to expression levels of genes with validated differential expression contained in validation subset A (D) and subset B (E) ( Supplementary Table S1 ). The percentage of the overall variance explained by PC1 and PC2, respectively, is given in parentheses. Throughout, sepsis patients are indicated in red and SIRS patients in blue.

