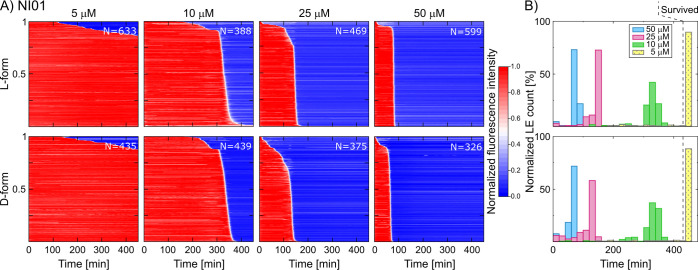
Figure 3.
All-L and all-D forms of NI01 compromise model bacterial membranes in a dose-dependent manner, showing similar modes of action. (A) Heat plots map the mode of action by summarizing the leakage kinetics of NI01 treated populations of PC/PG (3:1) GUVs. Each horizontal line depicts the normalized intensity of encapsulated HPTS dye in a single trapped vesicle over time. The vesicle’s membrane is considered intact at high fluorescence intensity (red) and compromised at low fluorescent signal (blue). The intensity traces were ordered by the LE time point. The total number of GUVs is displayed per experiment. (B) Histograms comparing the time distribution of LEs for both NI01 variants; vesicles that retained their integrity after 450 min of continuous peptide exposure (dashed line) were labeled as survived.

