
Figure 3.
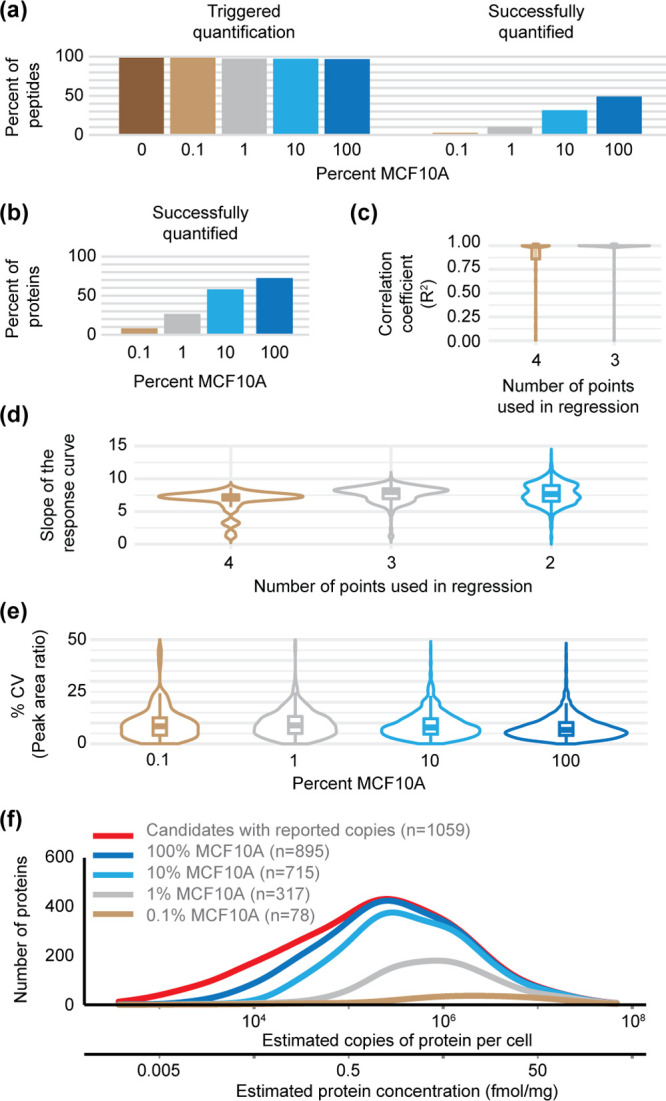
Characterization of the IS-PRM analytical performance. (a) Percent of peptides that triggered quantification (heavy peptides meeting the detection threshold and fragment ion requirement) and were successfully quantified (endogenous peptides meeting all quantification criteria with signal >2× the maximum signal in the blanks). (b) Percentage of the 1314 targeted proteins that were quantified. (c) Distribution of the correlation coefficients squared (R2) for quantified peptides using the top three (100, 10, and 1% MCF10A) or all four concentration points of the curve. (d) Distribution of slopes for peptides successfully quantified using the top two, three, or all four concentration points. (e) Precision of the replicates of heavy to light peak area ratios for each dilution point. For violin plots, the bold line shows median, box shows inner quartile, vertical line shows 5–95 percentile, density of measurements is indicated by the thin line. (f) Distribution of the number of proteins detected according to the protein level per cell (as reported in Ly et al.).