
Figure 4.
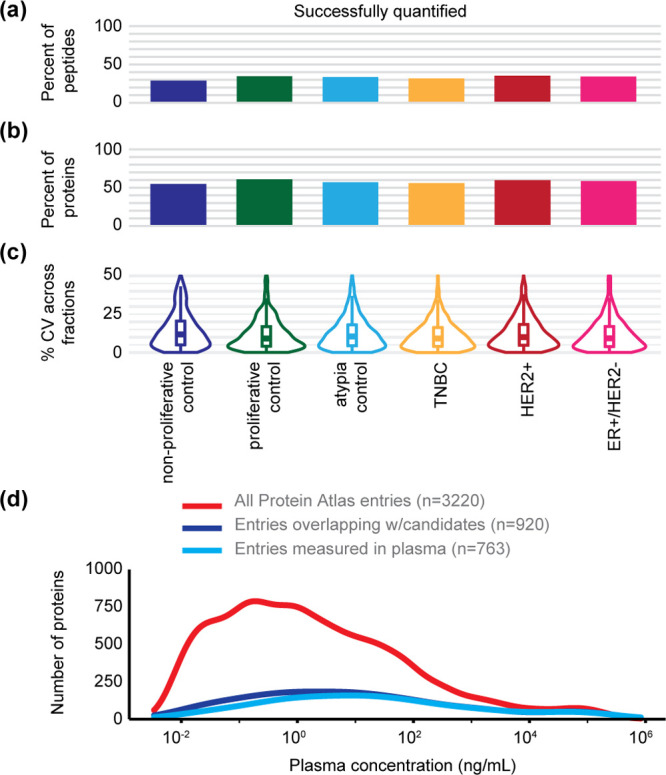
Applying the IS-PRM assay to prioritize the biomarker candidate proteins in plasma of human breast cancer patients. (a) Percent of endogenous light signals meeting quantification criteria with a signal >2× the maximum signal in the blanks in each of the plasma pools. (b) Percent of candidate protein biomarkers with endogenous levels measured in each of the plasma pools. (c) Violin box plot showing the technical variability of the replicate measurements of the heavy to light peak area ratios (PAR), measured by using the PAR in neighboring bRP fractions as technical replicates. Bold line shows median, box shows inner quartile, vertical line shows 5–95 percentile, density of measurements is indicated by the thin line. (d) Distribution of the number of proteins detected according to reported plasma concentration.