Figure 5.
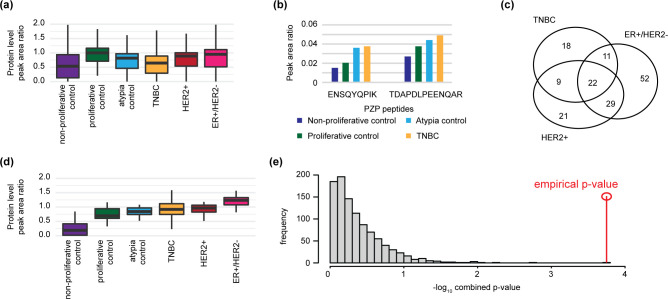
Verification of candidate biomarkers in the breast cancer plasma pools. (a) Endogenous levels in the depleted and fractionated plasma pools, reported as the peak area ratio (PAR; light/heavy) using the median value from multiple measurements of peptides. (b) PAR of quantified peptides from PZP in three control pools and triple negative breast cancer (TNBC). An example of a candidate biomarker meeting significance testing in the TNBC breast cancer subtype with endogenous levels significantly higher (p < 0.001) in cancer compared to at least two of the three confounding control plasma pools with a significant regression trend (p < 0.01; trend comparing nonproliferative control → proliferative control → atypia control → cancer subtype). (c) Venn diagram of the 162 candidate biomarkers verified in the pooled case/control study. A total of 22 of the candidates passed both cutoffs (p-value < 0.001 and regression trend p-value < 0.1) in all three breast cancer subtypes. (d) Endogenous levels of the 22 proteins found higher in all three breast cancer subtypes compared to the three confounding control samples. For box plots, bold line shows median, box shows inner quartile, vertical line shows 5–95 percentile. (e) Combined p-value from differentiation between cancer subtypes and control plasma pools using randomly sampled subsets of 22 proteins (1000 permutations). The p-value for the set of overlapping 22 proteins verified by IS-PRM assay (p = 0.00016) is shown by the red line. p-Values are based on a student t test.

