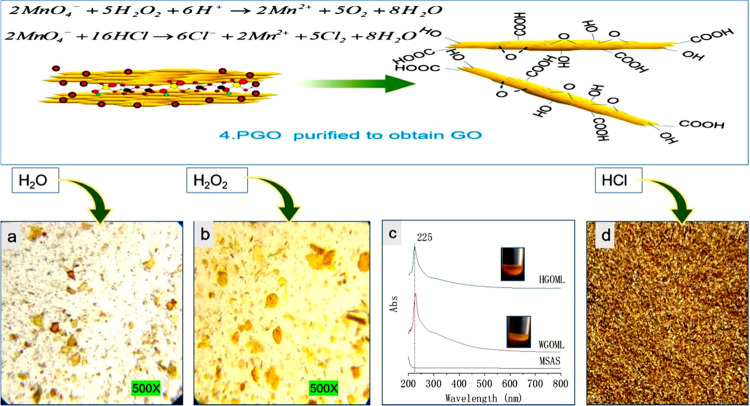
Figure 5.
Optical microphotographs (500×) and UV–vis spectra of the process of GO from PGO. (a) Optical microphotographs (500×) of PGO in WGOML. (b) Optical microphotographs (500×) of PGO in HGOML. (c) UV–vis spectra of MSAS, WGOML, and HGOML. (d) Filter cake after washing with hydrochloric acid and vacuum extraction.

