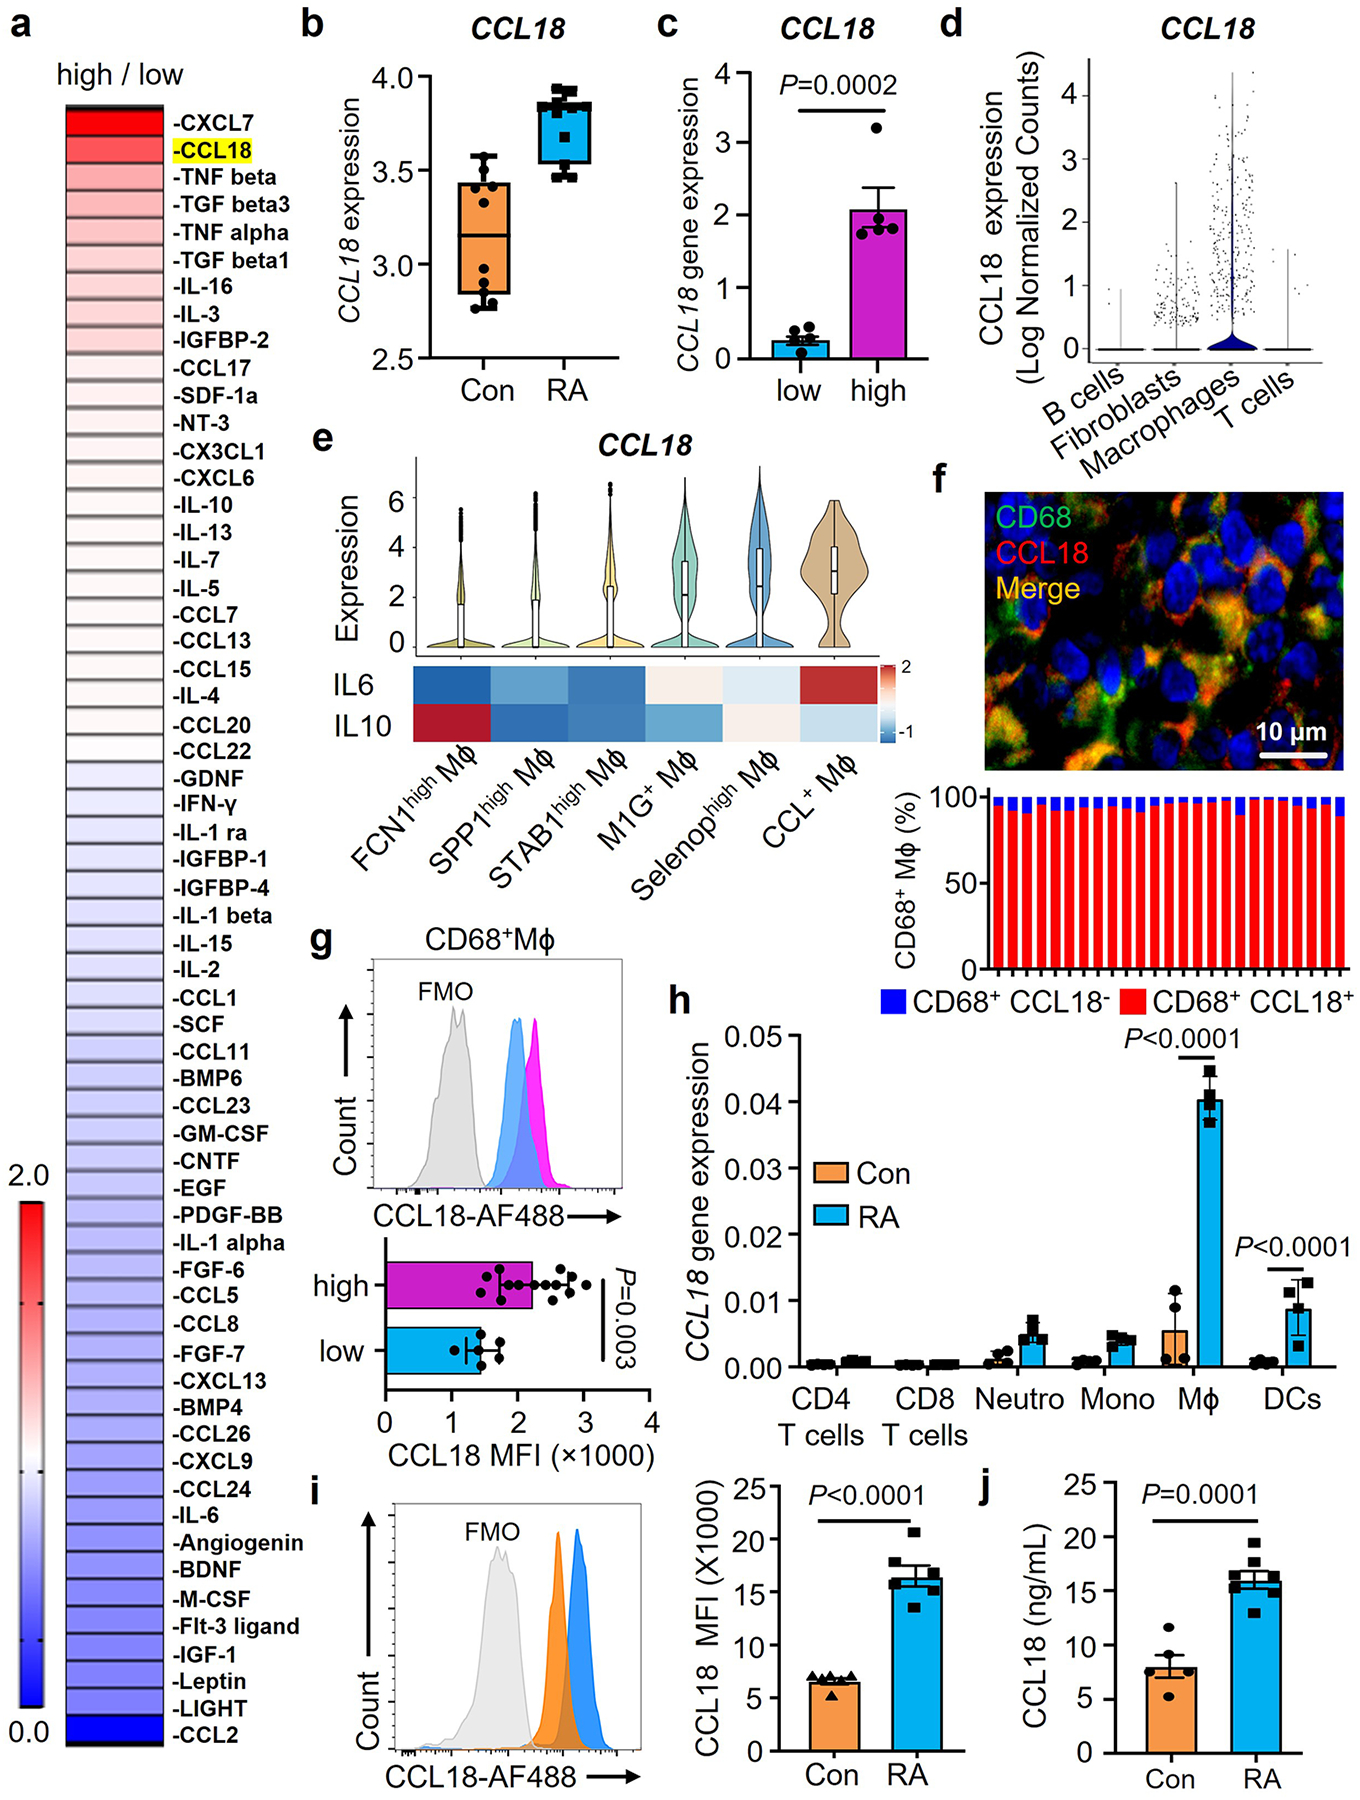
Fig. 4. Synovial Mϕ are CCL18 high producers.

a. Tissue cytokines and chemokines were quantified in with high-grade and low-grade RA synovitis (n=4). Data are presented as fold change in high grade compared to low grade synovitis and are sorted by abundance of 60 cytokines/chemokines. Color scales are presented by fold change.
b. CCL18 gene expression was evaluated by RNA-seq analysis in healthy synovium (n=10) and RA synovitis (n=13). Data are in box and whisker plot. Original data sets (GSE55457) from Arthritis Res Ther. 2014 Apr 1;16(2): R84.
c. CCL18 transcript concentrations in low-grade (n=5) and high-grade (n=5) RA synovitis measured by qPCR.
d. CCL18 gene transcripts were evaluated in 22 cell populations from rheumatoid synovia (n=18) by single cell RNAseq. Original data from Nature Imm. (20) 928–942 (2019).
e. CCL18, IL-10 and IL-6 gene expression in synovial macrophages (n=20). Comparison of CCL18, IL-10 and IL-6 transcripts in 6 macrophage subsets (FCN1high Mϕ, SPP1high Mϕ, STAB1high Mϕ, M1G+ Mϕ, Selenophigh Mϕ, CCL+ Mϕ). CCL18 data presented as violin blots. IL-10 and IL-6 data presented as heatmap. Color scales are average log2(fold change). Original data from Nat Commun. 2021 Aug17;12(1):4977.
f. Dual-color immunofluorescence staining for CD68 (green) and CCL18 (red) in tissue sections from high-grade synovitis (n=5). Frequencies of CCL18+CD68+ cells in 25 different regions of the inflamed synovia and representative images from 5 tissues.
g. Intracellular CCL18 protein was measured by flow cytometry in CD68+ Mϕ isolated from RA synovia with low-grade (n=6) and high-grade inflammation(n=14).
h. CCL18 transcripts measured in different immune cell populations by qPCR (n=4).
i-j. Monocyte-derived Mϕ were generated from RA patients and matched controls Intracellular CCL18 protein was measured by flow cytometry 24h after LPS/IFN stimulation (i, n=6). Secreted CCL18 was quantified in the supernatant (j, nCon=5, nRA=7).
Data are mean ± SEM. (c, g, i-j) Two-tailed unpaired t test. (h) Two-way ANOVA with post hoc Tukey’s multiple comparisons test.
