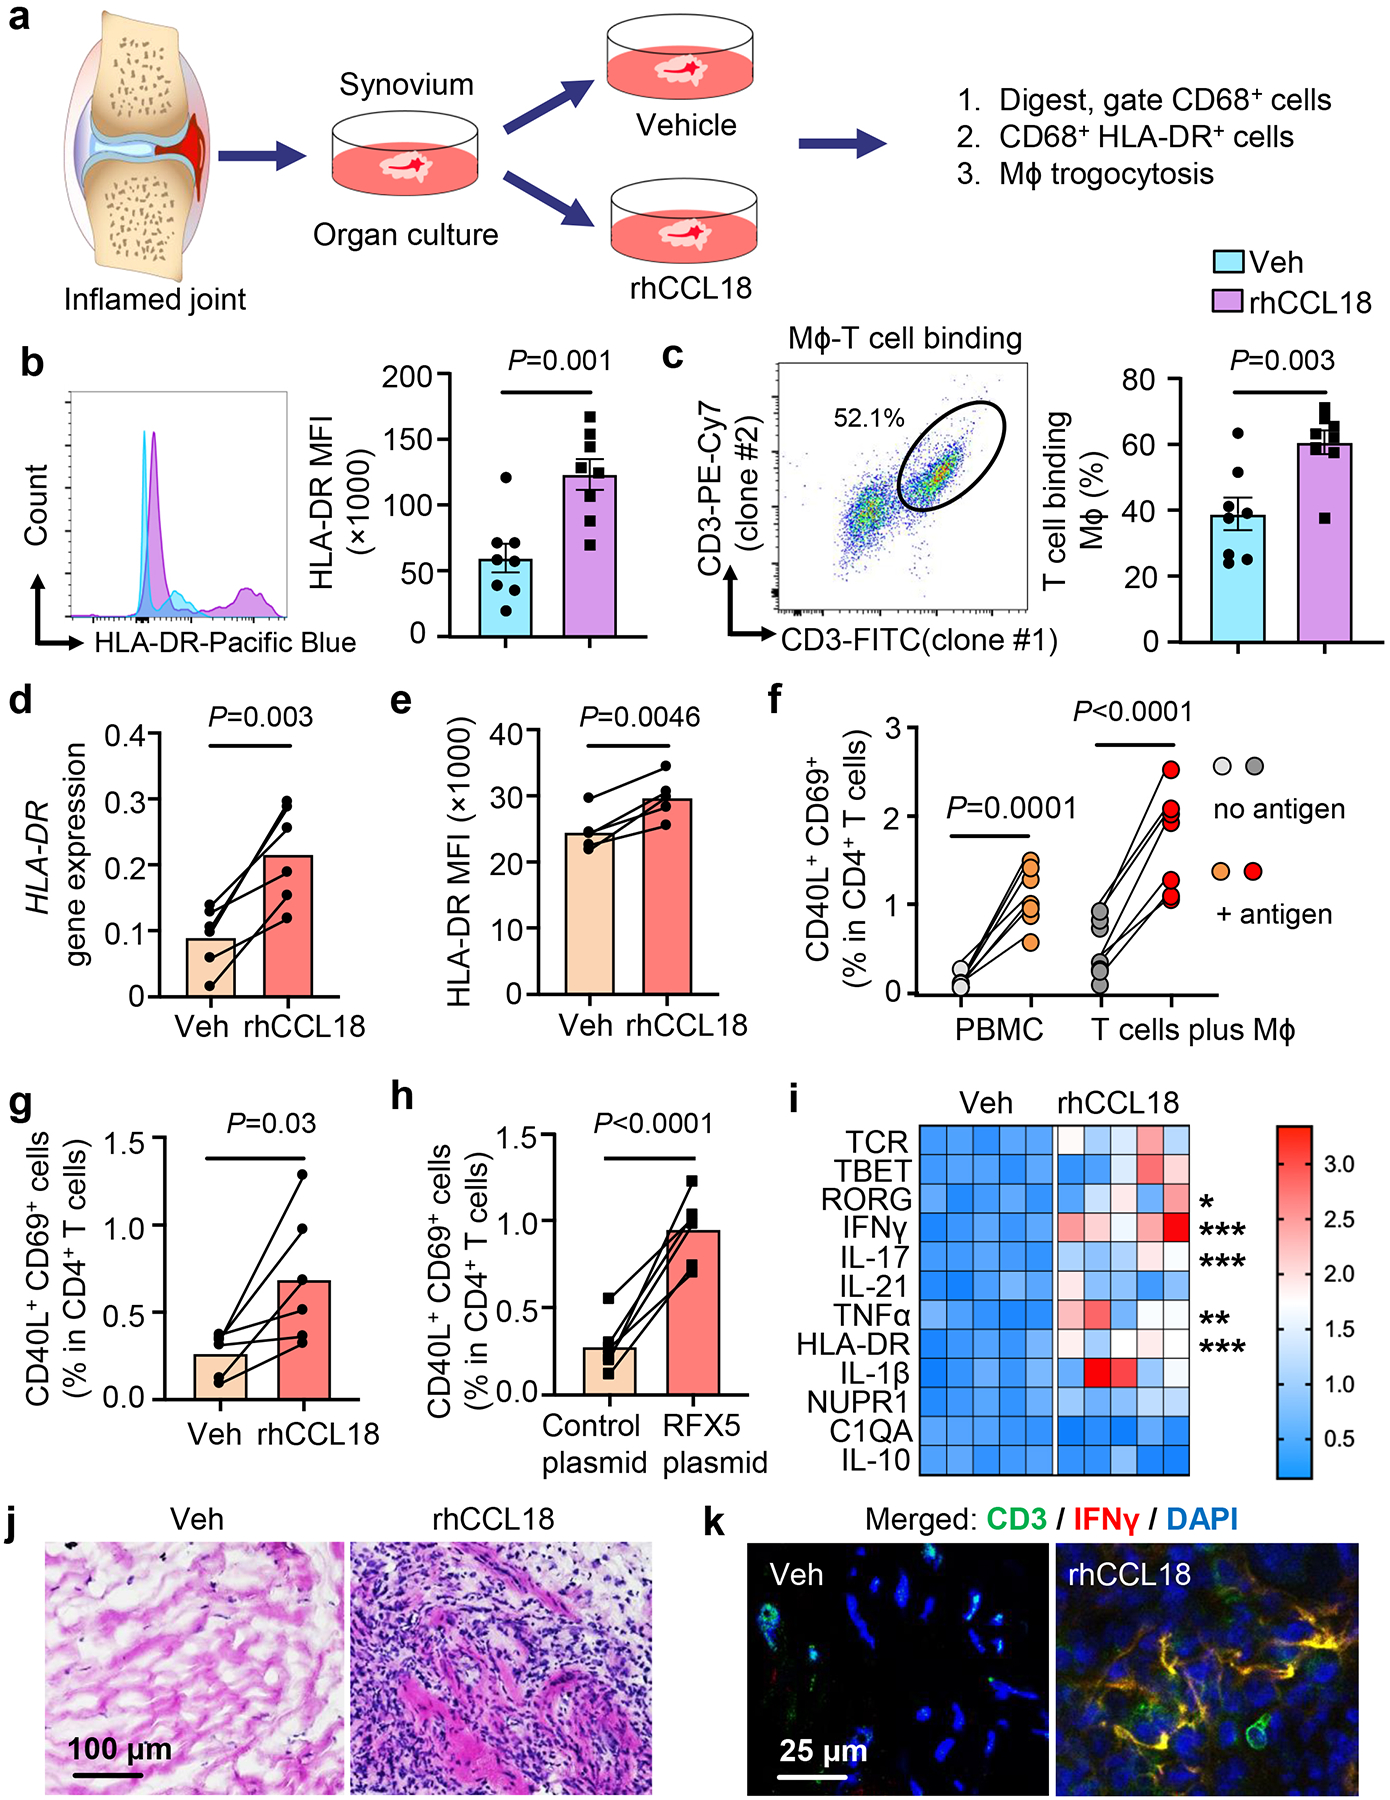
Fig. 7. CCL18-induced RFX5 enhances HLA-DR expression and antigen presentation.

a-c. Sections of intact, freshly harvested RA synovial tissue (10 mm long and 2-mm thick segments) were cultured in medium supplemented with vehicle or rhCCL18 (50 ng/mL) for 24–48h (n=8). CD68+ Mϕ were analyzed by flow cytometry. Diagram of organ culture (a). HLA-DR expression (b). Representative dot plot and frequencies of CD68+ cells containing CD3+ membrane fragments (c).
d-e. Healthy Mϕ were glucose deprived and treated with rhCCL18 (50 ng/mL) for 2 days. HLA-DR expression was quantified by qPCR (d, n=6) and flow cytometry (e, n=5).
f. Candida albicans protein was added to PBMC and the frequencies of CD40L+CD69+ T cells were compared in culture with and without antigen on day 7. Candida albicans antigen-primed T cells were restimulated with syngeneic Mϕ that were loaded with either vehicle or Candida albicans protein overnight. Six hours after restimulation, antigen-reactive CD4+ T cells were detected flow cytometrically as the population of CD40L+ CD69+ T cells (n=7).
g. Healthy Mϕ we treated with rhCCL18 (50 ng/mL), loaded with Candida albicans protein and used to restimulate primed T cells. Antigen-specific T cell responses were measured as in f (n=6).
h. Healthy Mϕ were transfected with a RFX5 overexpression plasmid, loaded with Candida albicans protein and used to restimulate primed T cells (n=6). Antigen-reactive T cells were identified after 6 hours as CD40L+ CD69+ in total CD4+ T cells.
i-k. Chimeras were treated with rhCCL18 for 7 days as in Fig.4. (i) Heatmap presentation of transcriptomic analysis (qPCR) of 12 inflammatory markers (n=5). Color scales are presented by fold change. *P=0.0293, ***P=0.0002, ***P=0.0008, **P=0.0034, ***P=0.0001, from up to down. (j) H&E staining of tissue sections comparing density of inflammatory infiltrates. (k) Immunofluorescence quantifying IFN-γ-producing (red) CD3+ (green) T cells. Nuclei marked with DAPI. Images representative of 5 independent experiments.
Data are mean ± SEM. (b-c, i) Two-tailed unpaired t test. (d-h) Two-tailed paired t test. *P < 0.05; **P < 0.01; ***P < 0.001.
