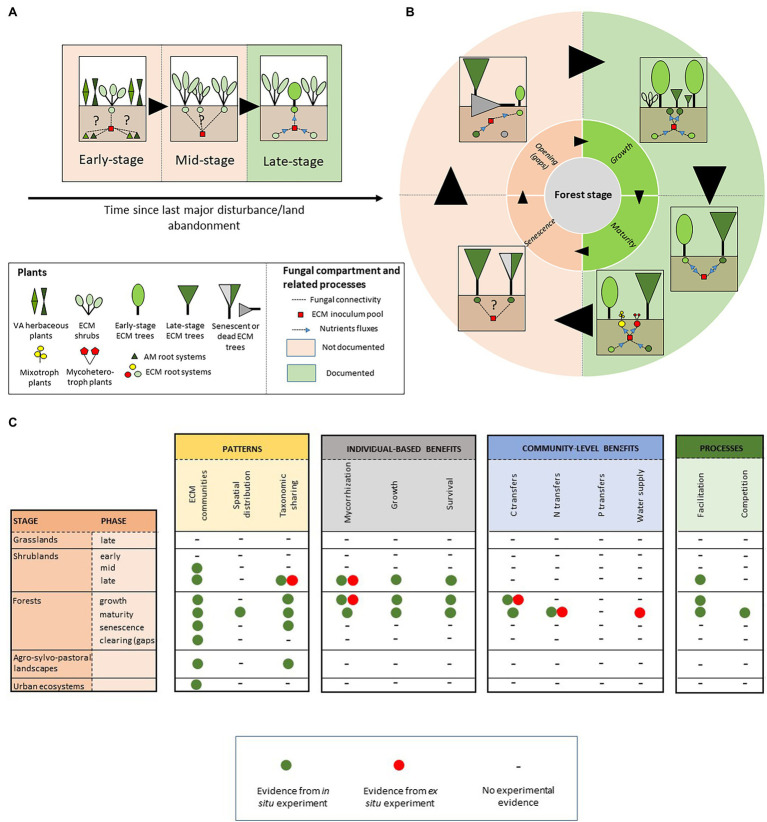
Figure 1.
Schematic representation of ectomycorrhizal-based networks (A) across early ecological succession and (B) during sylvigenetic cycle. Dashed lines indicate plant–plant interactions through ECM CMNs. Blue arrows indicate nutrient transfers through ECM CMNs. (C) Summary of ECM network-related effects documented along the chronosequence.

