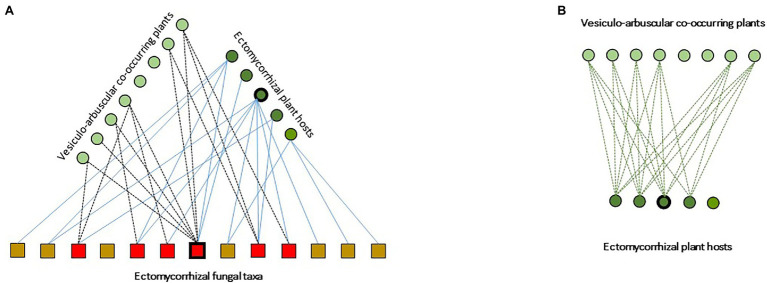
Figure 2.
Schematic representation of ectomycorrhizal-based multipartite networks in Tuber ssp. temperate agroforests, from Schneider-Maunoury et al. (2018) modified. (A) Species of co-occurring ectomycorrhizal and arbuscular mycorrhizal plants are represented by dark and clear green dots, respectively. The different taxa of ECM fungi are represented by squares. Interaction hubs are indicated by thickened outlines (here, Quercus ilex and Tuber melanosposrum). Solid lines indicate plant-fungi ECM interaction links. Dotted lines indicate interaction links between ECM fungal tava and VA plants. (B) Schematic representation of the corresponding projected VA-ECM plant network.

